DXY Elliott Wave: Bearish Divergence Caps Wave (c) of V
Not much to fix here, honestly, this one already sounds like a trader wrote it. Just a couple tweaks:
The dollar found more room to climb than expected. That happens. Structure still matters more than our timing.
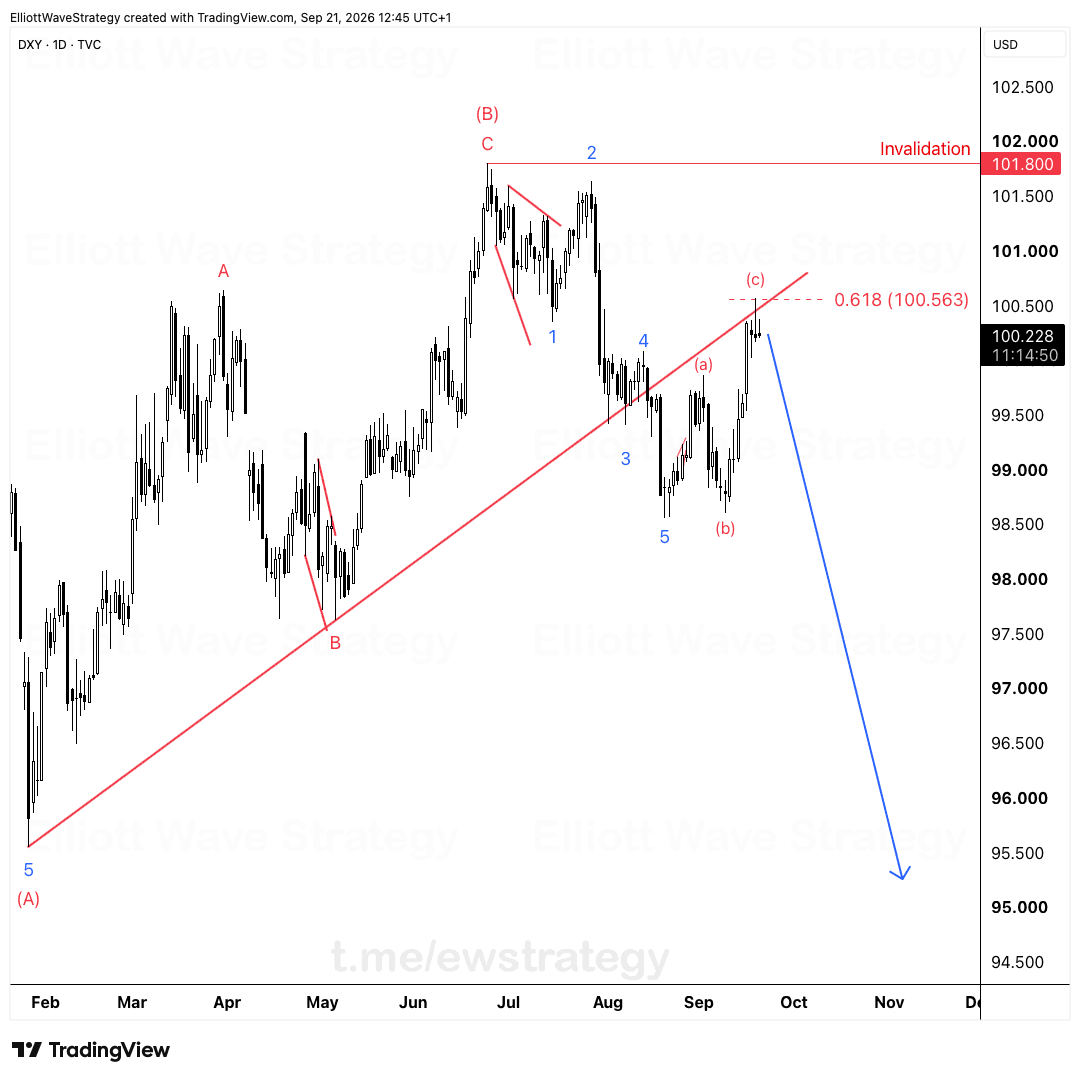
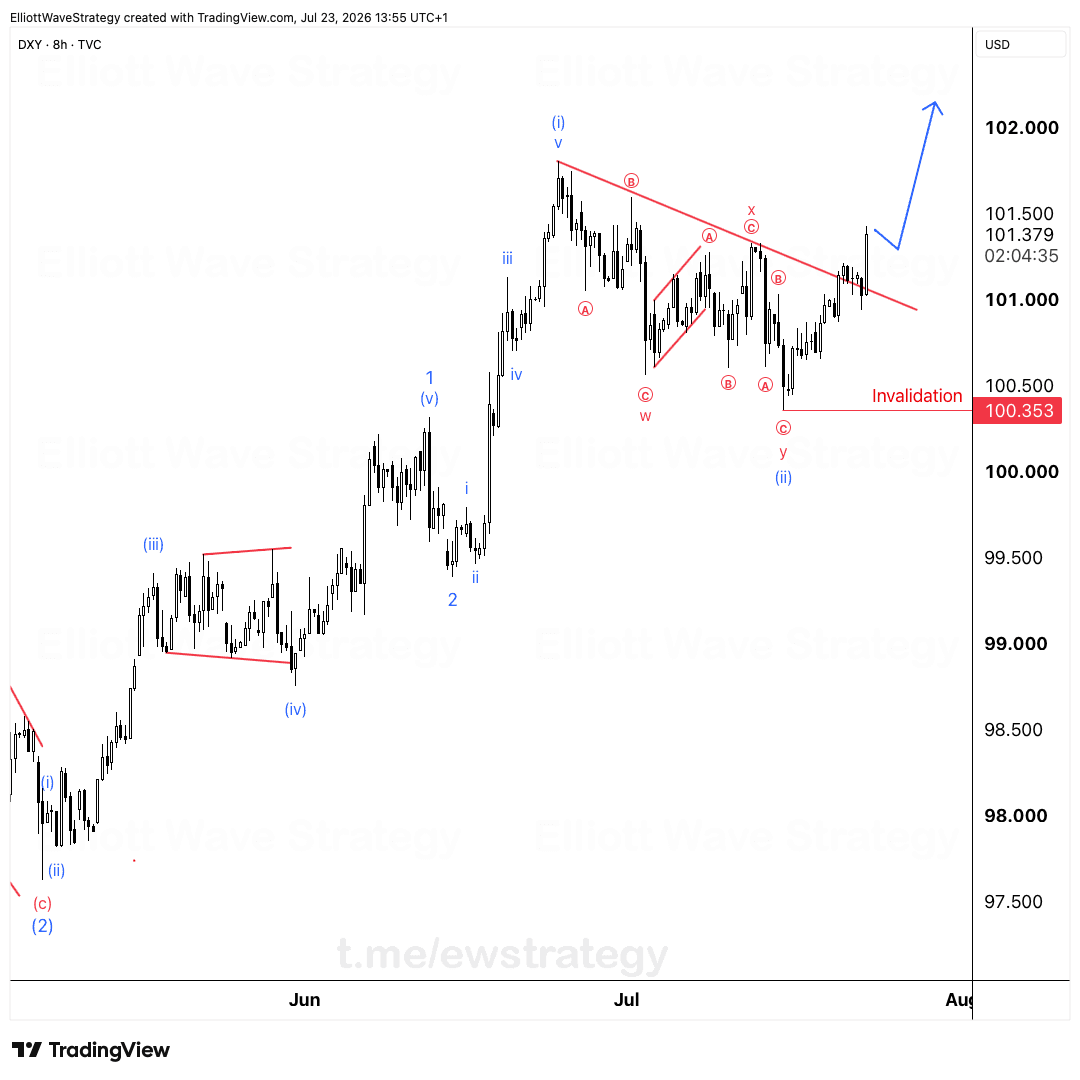
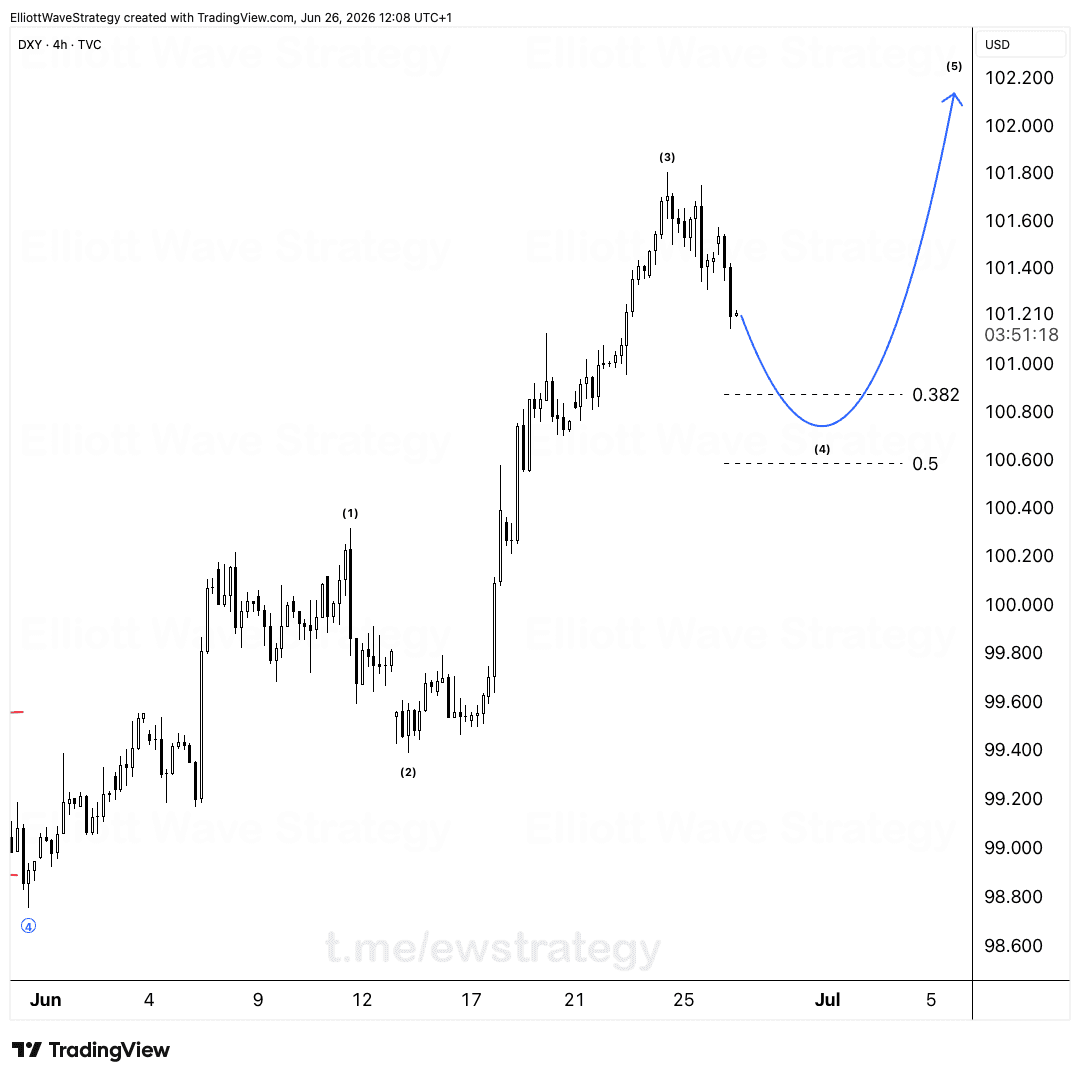
On the 4h chart, DXY is counting a completed 5-wave impulse into wave (c) of v of 5. Price pushed to a new high above 101.279, but the RSI refused to follow it there. That's a textbook warning, not a confirmation, and it's sitting right on the chart for anyone counting waves on the dollar index right now.
Why does the RSI divergence matter here
A new price high with a lower RSI reading tells you momentum is fading even while price grinds higher. That's exactly what's printed on this DXY chart. The rally into wave (c) made the high, but the RSI failed to confirm it, and that gap between price and momentum is the first crack in the bullish structure.
The RSI uptrend line drawn from September is still intact. Until that line breaks, this divergence is just a flag on the chart, not a trigger. Divergence alone has ended plenty of counts early for traders who jumped the gun. The next piece of evidence we actually want is a clean break of that RSI trendline. Until it breaks, the bearish case stays a warning sign.
What happens below 101 on DXY
If price drops below 101, downside momentum should pick up speed. The next zone of interest sits at the 0.886 retracement near 98.710, a level already marked on the chart from the prior swing. That's where the structure argument gets real weight behind it, not before.
Right now DXY is not below 101 yet. No position is justified until the structure actually proves itself with that break. Anyone trading the level before price confirms it is trading a guess, not a wave count.
What invalidates the bearish DXY count
Above 101.800 the bearish count is dead and the rally continues. That's the invalidation line drawn directly on the chart, and it's not a soft suggestion. A close above it means wave (c) of v of 5 wasn't the end of the impulse, and the dollar index is still climbing.
Map the levels. Let price talk. The RSI divergence is real, the trendline is intact, and the invalidation is clear. Everything else is noise until one of those three things actually happens.
Key Takeaways
- •DXY completed a 5-wave impulse into wave (c) of v of 5 with price making a new high above 101.279.
- •Bearish RSI divergence is visible on the DXY chart even though price hit a fresh high.
- •A break of the RSI uptrend line from September is the next confirmation the bearish DXY count needs.
- •Below 101, DXY downside momentum should accelerate toward the 0.886 zone near 98.710.
- •Above 101.800, the bearish DXY count is invalidated and the rally continues.
Frequently Asked Questions
What invalidates the bearish DXY Elliott Wave count?
A close above 101.800 invalidates the bearish count. That level is marked directly on the chart as the invalidation line for the completed impulse.
Why hasn't the bearish DXY setup been confirmed yet?
Price hasn't broken below 101 yet, and the RSI uptrend line from September is still intact. Both need to break before the bearish structure is confirmed, not just suggested by divergence.
What is the downside target if DXY breaks below 101?
The 0.886 Fibonacci retracement zone near 98.710 is the level in focus if downside momentum picks up below 101.
Disclaimer: This analysis is for educational purposes only and does not constitute financial advice. Elliott Wave analysis involves subjective interpretation. Always do your own research and manage your risk accordingly.
Get Full Coverage for All 27 Instruments
Premium members receive daily wave counts with entry zones, targets and invalidation levels, published daily across all 27 instruments.
View Premium Plans