EURUSD Elliott Wave: Bounce Off Fib Zone or Reversal?
Bounce or reversal? The structure has an answer.
Bounce or reversal? The structure has an answer, even if most traders won't wait for it.
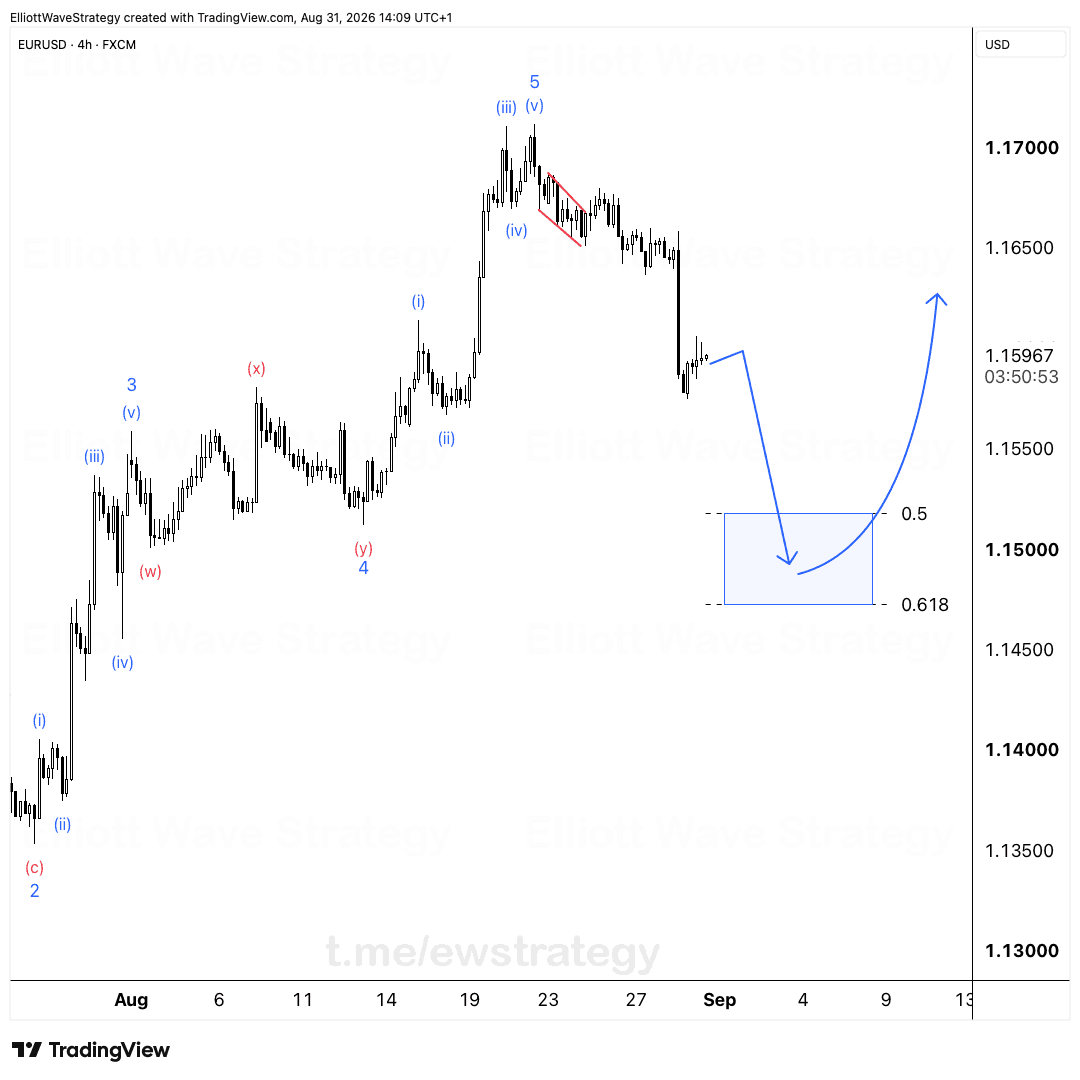
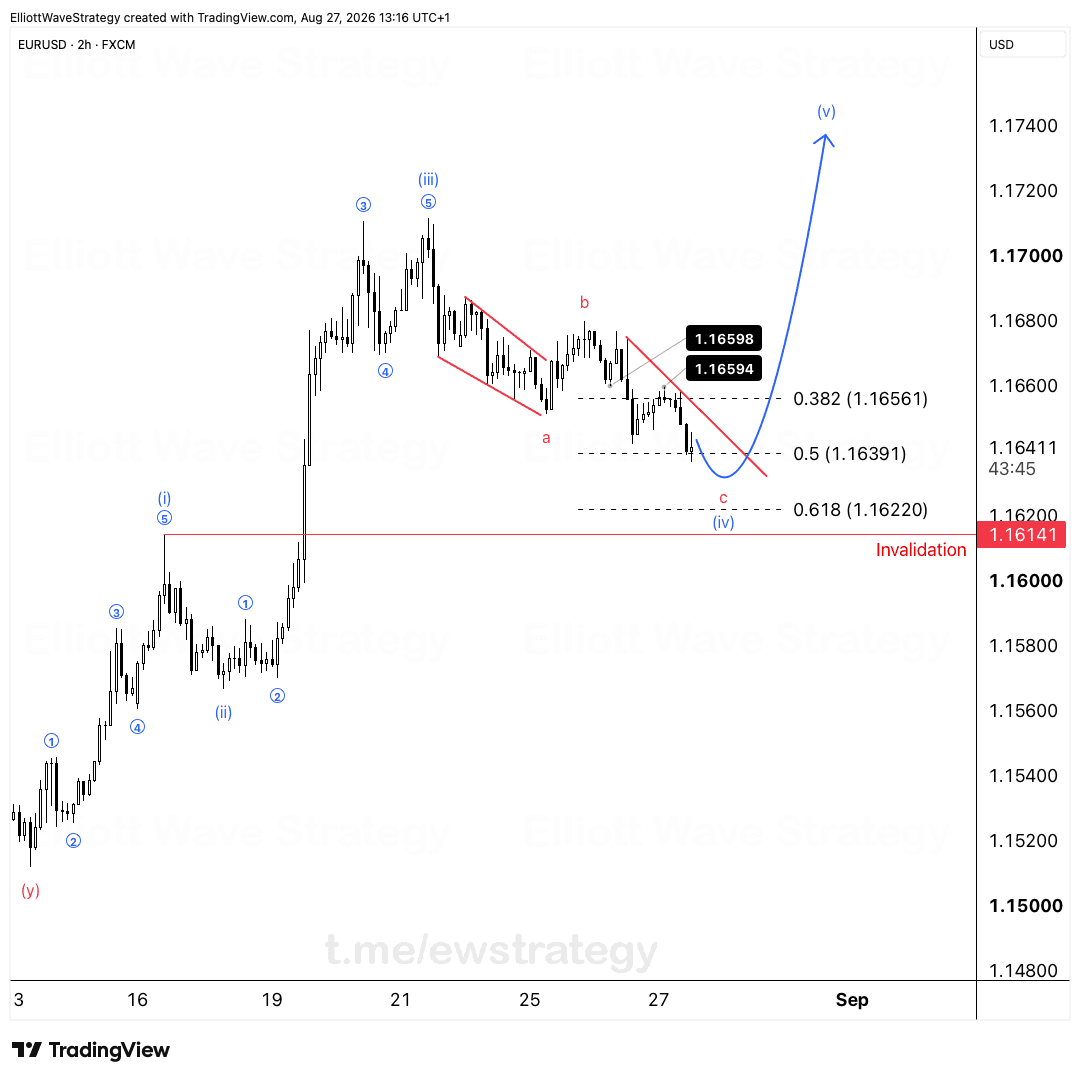
We've tracked this EURUSD correction with updates on September 10th and 14th. Our zone to watch was 1.14723-1.15180, the 0.618 and 0.5 Fibonacci retracement levels on the 4h chart. Price broke below that zone, dropped into wave (c) of v, and now it's bouncing straight back into the same area.
So is the correction done? Maybe. But one bounce off a Fib zone doesn't confirm anything by itself.
What does the current EURUSD wave count show?
The decline from the (b) wave high broke down into a five wave structure, i through v, with wave (c) of v completing the move lower. That fifth wave dropped straight through the 1.14723 level, the 0.618 retracement, before turning up.
This is a textbook zigzag completion by count, but completion of a pattern and confirmation of a reversal are two different things. The wave labels on the chart show iii and v both undercutting the zone before the bounce started.
What would confirm the correction is actually over?
Now we watch how this move up plays out, then how the next pullback shapes up. If structure holds the way it should, a higher low forms before the next leg higher.
That's the whole test. A bounce that immediately gets erased by a lower low tells you the decline isn't finished. A bounce followed by a shallow pullback that holds above the recent low tells you something changed in the structure.
The blue arrow on the chart shows one possible path: a push up, a pullback that holds higher, then a resumption toward 1.16000 and beyond. That's not a prediction. It's a map of what confirmation would look like if it shows up.
Why does one bounce off a Fibonacci zone mean so little on its own?
Because price bounces off levels all the time without anything structural changing underneath. The 1.14723-1.15180 zone got tested from above during the decline and now it's getting tested from below during the bounce. That symmetry looks satisfying on a chart, but it says nothing about what happens next until the next pullback prints.
Traders who react to the first bounce and call it a reversal are trading the candle, not the structure. The structure needs the higher low. Without it, wave v of (c) could still be incomplete, or a new leg lower could be starting.
Closing thought
Save this chart. Compare it against the next update. That's how you learn to read EURUSD structure instead of reacting to every candle that pokes above a Fibonacci line.
Key Takeaways
- •EURUSD wave (c) of v completed the decline after breaking below the 1.14723-1.15180 retracement zone.
- •The current EURUSD bounce is retesting the same zone it broke below, but a single bounce does not confirm a reversal.
- •A higher low needs to form on the next EURUSD pullback before the next leg higher can be considered confirmed.
- •The blue arrow on the EURUSD chart is a map of a possible path toward 1.16000, not a forecast or trade signal.
- •Comparing this EURUSD structure against future updates is the way to judge whether the correction is actually finished.
Frequently Asked Questions
Is the EURUSD correction finished after this bounce?
Not confirmed yet. Wave (c) of v completed the decline structurally, but the bounce into the 1.14723-1.15180 zone needs to be followed by a higher low on the next pullback before the correction can be considered over.
What level was EURUSD watching before the bounce?
The 1.14723-1.15180 zone, marking the 0.618 and 0.5 Fibonacci retracements, was the area flagged in prior updates on September 10th and 14th. Price broke below it before bouncing back into it.
What would invalidate the bullish path shown by the blue arrow?
If the next pullback carves a lower low instead of a higher low, the structure would suggest the decline is continuing rather than reversing, invalidating the path drawn on the chart.
Disclaimer: This analysis is for educational purposes only and does not constitute financial advice. Elliott Wave analysis involves subjective interpretation. Always do your own research and manage your risk accordingly.
Get Full Coverage for All 27 Instruments
Premium members receive daily wave counts with entry zones, targets and invalidation levels, published daily across all 27 instruments.
View Premium Plans