GBPJPY Elliott Wave: Wave 4 Bounce Before New Low?
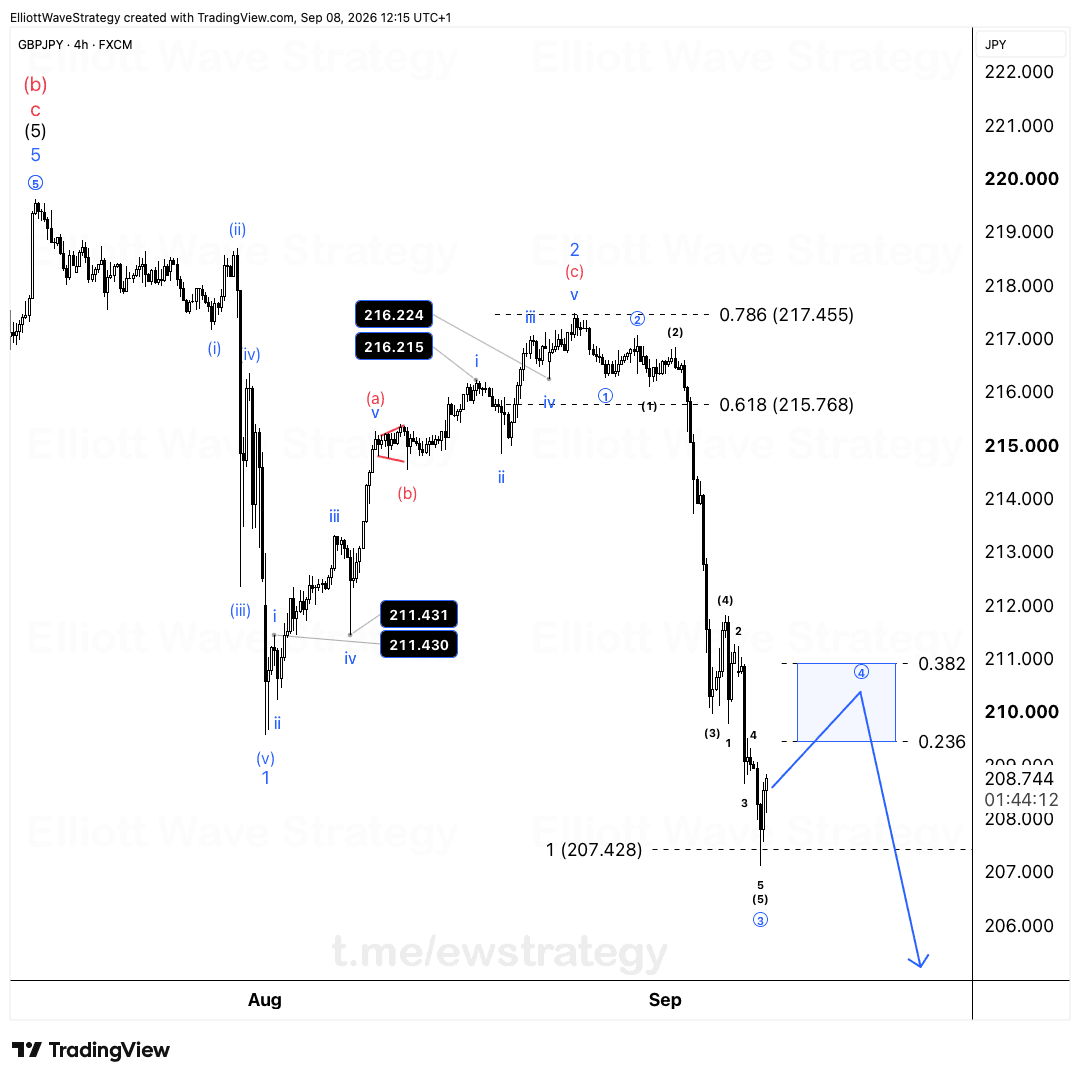
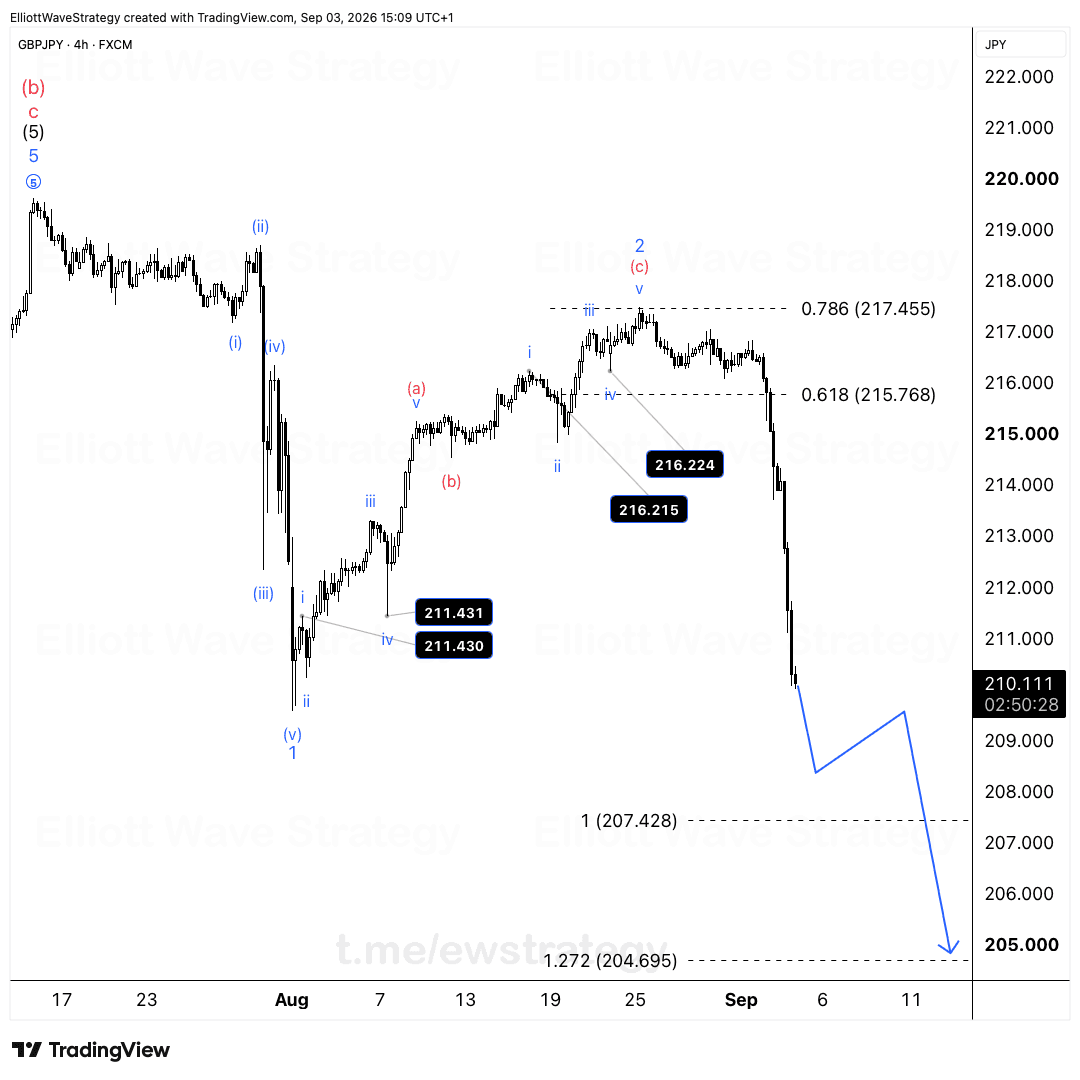
On September 3rd, we mapped further downside. Price hit 207.428, right where we expected. On September 8th, we flagged a corrective bounce before another leg lo
GBPJPY did exactly what the count said it would. On September 3rd we mapped further downside, price hit 207.428, right where we expected. On September 8th we flagged a corrective bounce before another leg lower. Now that bounce is dragging its feet, and that's the part traders keep getting wrong.
Why is GBPJPY's Wave 4 taking so long?
Wave 4 is still working itself out. Price is holding below our marked zone at the 0.236 to 0.382 fib area, which on the chart sits roughly between 208.852 and the upper edge of the blue box near 210.
This is what Wave 4s do. They test patience and burn out traders who mistake a bounce for a reversal. The structure so far shows an A-B-C style recovery off the low, with wave (B) already printed and wave C or the (c) leg still trying to finish inside that shaded zone.
Slow corrections are not a sign the bearish case is broken. They're often the opposite: the market grinding out a wave 4 exactly because it needs time, not because it needs to reverse trend.
What happens once the Wave 4 bounce completes?
What we're watching is the bounce completing inside the blue zone, then a fresh impulse lower. The chart shows a drawn projection from around the top of the blue box heading straight down toward 205 and beyond.
If the C wave confirms, 204.695 is the first target. That level is the 1.272 extension marked on the chart. Below that, 201.220 sits at the 1.618 extension as the further downside objective if momentum carries through.
This lines up with the broader move already in place. Price came down from the (2)(c) high near 217 through a clean five wave decline into 207.428, labeled wave ③ on the chart. What's unfolding now is the wave ④ correction before that decline potentially extends into a wave ⑤.
What would invalidate the bearish GBPJPY count?
The bearish count stays valid below 216.256. That level is marked directly on the chart as the invalidation line, sitting above the 0.786 retracement at 217.455.
Above 216.256, the picture changes. A break through there would undermine the idea that the decline from the (2)(c) top is still in progress, and the whole wave 4 versus new trend debate would need a rethink.
Until then, the fib zone between 208.852 and roughly 210 is the area doing the work. Price staying capped there keeps the corrective bounce intact and keeps the door open for the next leg down.
Final thought
We don't chase the bounce. We wait for it to finish and let the structure tell us when the next leg down starts. GBPJPY has already delivered one clean move to 207.428, and the current pause is just wave 4 doing what wave 4 always does before the next impulse takes over.
Key Takeaways
- •GBPJPY hit its projected 207.428 target on September 3rd before starting a corrective bounce.
- •The current GBPJPY bounce is a slow-forming wave 4, capped by the 0.236-0.382 fib zone near 208.852 to 210.
- •A completed C wave inside the blue zone would open the door to a fresh GBPJPY decline toward 204.695 first, then 201.220.
- •The bearish GBPJPY count remains valid as long as price stays below 216.256.
- •Wave 4 corrections are designed to test patience, not signal a trend reversal.
Frequently Asked Questions
What invalidates the bearish GBPJPY Elliott Wave count?
A move above 216.256 would invalidate the current bearish structure, since that level is marked as the invalidation point above the 0.786 retracement near 217.455.
Why is the GBPJPY wave 4 bounce taking so long?
Wave 4 corrections often move slowly and choppily by nature, testing trader patience while price stays capped below the 0.236-0.382 fibonacci zone before the next impulse begins.
What are the downside targets if GBPJPY's C wave confirms?
The first target is 204.695, based on the 1.272 extension, with 201.220 as a further extension target at the 1.618 level if the decline continues.
Disclaimer: This analysis is for educational purposes only and does not constitute financial advice. Elliott Wave analysis involves subjective interpretation. Always do your own research and manage your risk accordingly.
Get Full Coverage for All 27 Instruments
Premium members receive daily wave counts with entry zones, targets and invalidation levels, published daily across all 27 instruments.
View Premium Plans