USOIL Elliott Wave: 101.21 Decides the Next Leg Higher
One more push for oil?
One more push for oil? That's the question on the table right now.
The last update on USOIL flagged a pullback before another leg higher. That played out. Oil has advanced since, and the updated wave count leaves room for wave v to complete the larger structure that started back in July.
101.21 is the level that matters here. Everything else is noise until price tells you what it's doing around that number.
What happens if USOIL holds above 101.21
Hold above 101.21 and the wave v scenario stays alive. On the chart, price is working through a smaller ⑤ wave, with waves i through iv already labeled inside it. The pullback into iv found support right near that 101.21 line, which is exactly why it carries weight now.
The first target sits at 114.60, marked as the 1.0 extension on the chart. If momentum keeps building beyond that, 118.24 comes into play as a stretch target, drawn at the 1.272 extension. Both levels are projections tied to the wave v structure, not promises.
What happens if USOIL breaks below 101.21
Break below 101.21 and this short-term count needs revising. That's the invalidation point marked directly on the chart, sitting just under the recent wave iv low. A break there doesn't just delay the bullish scenario, it forces a rethink of how the entire leg from July is structured.
This is why the level gets called out specifically instead of a vague zone. Wave iv shouldn't overlap deep into wave i territory in a clean impulse, and 101.21 is where that logic gets tested in real time.
Is this a new bull trend or the end of a correction?
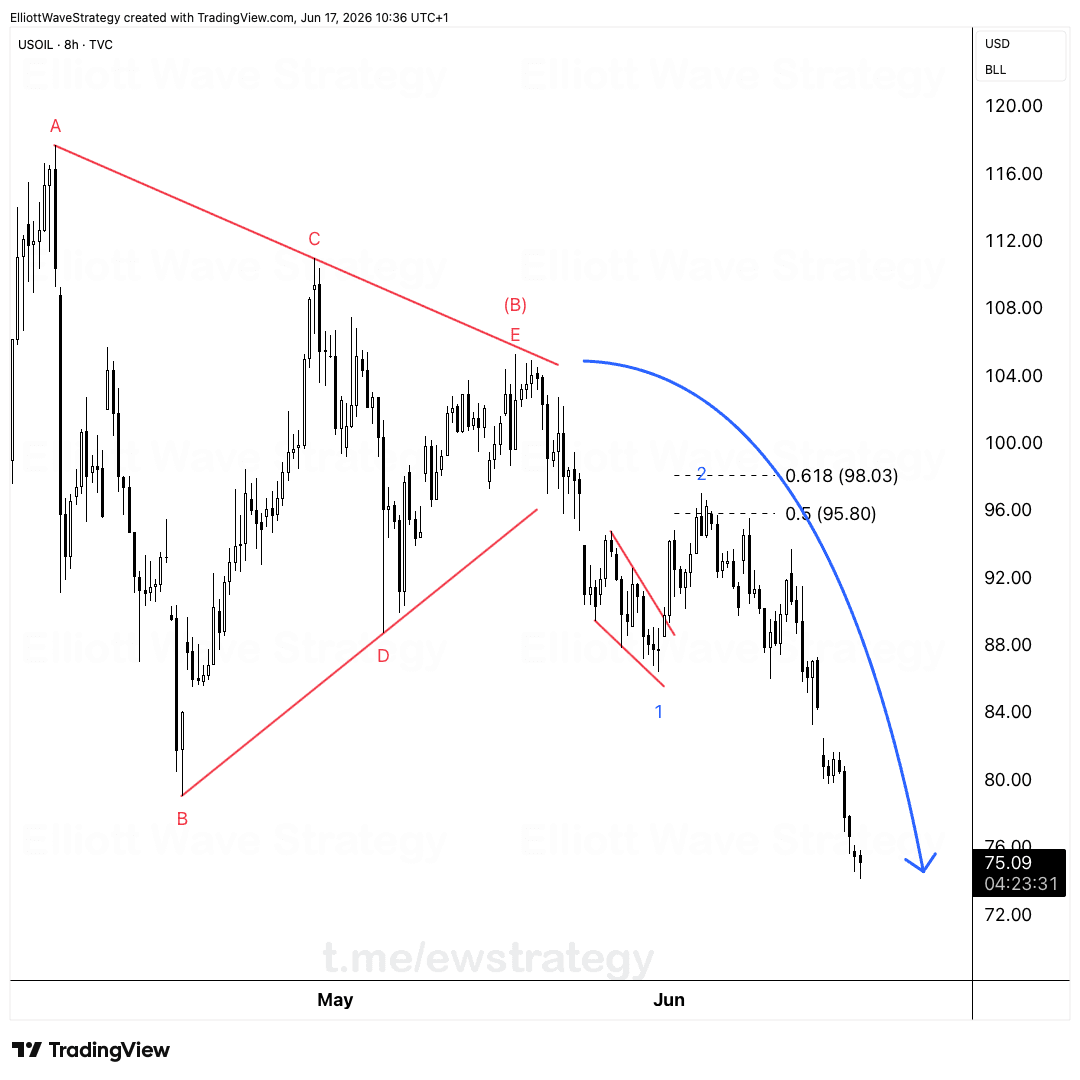
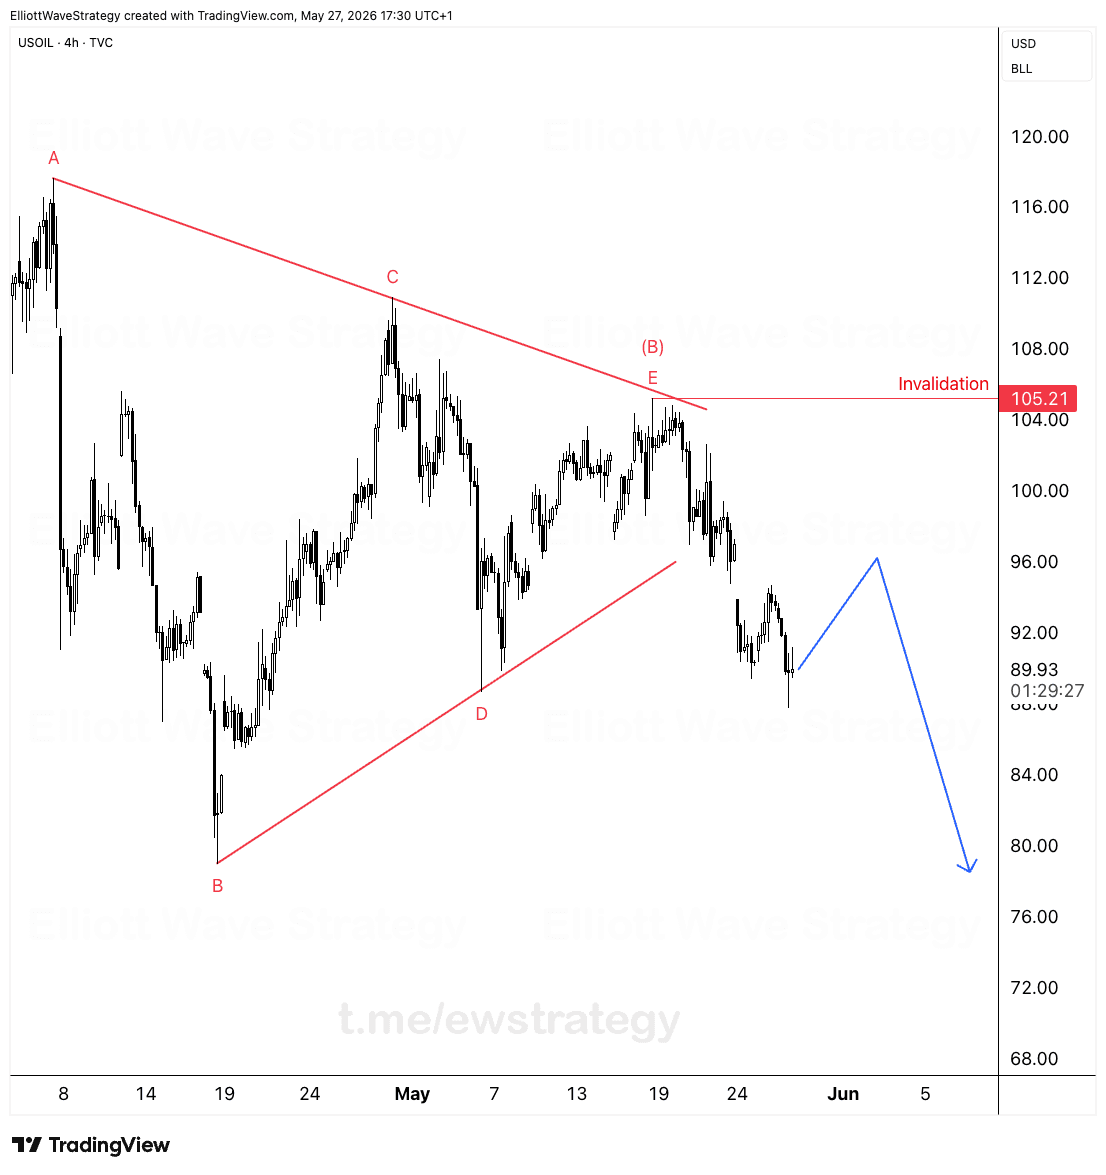
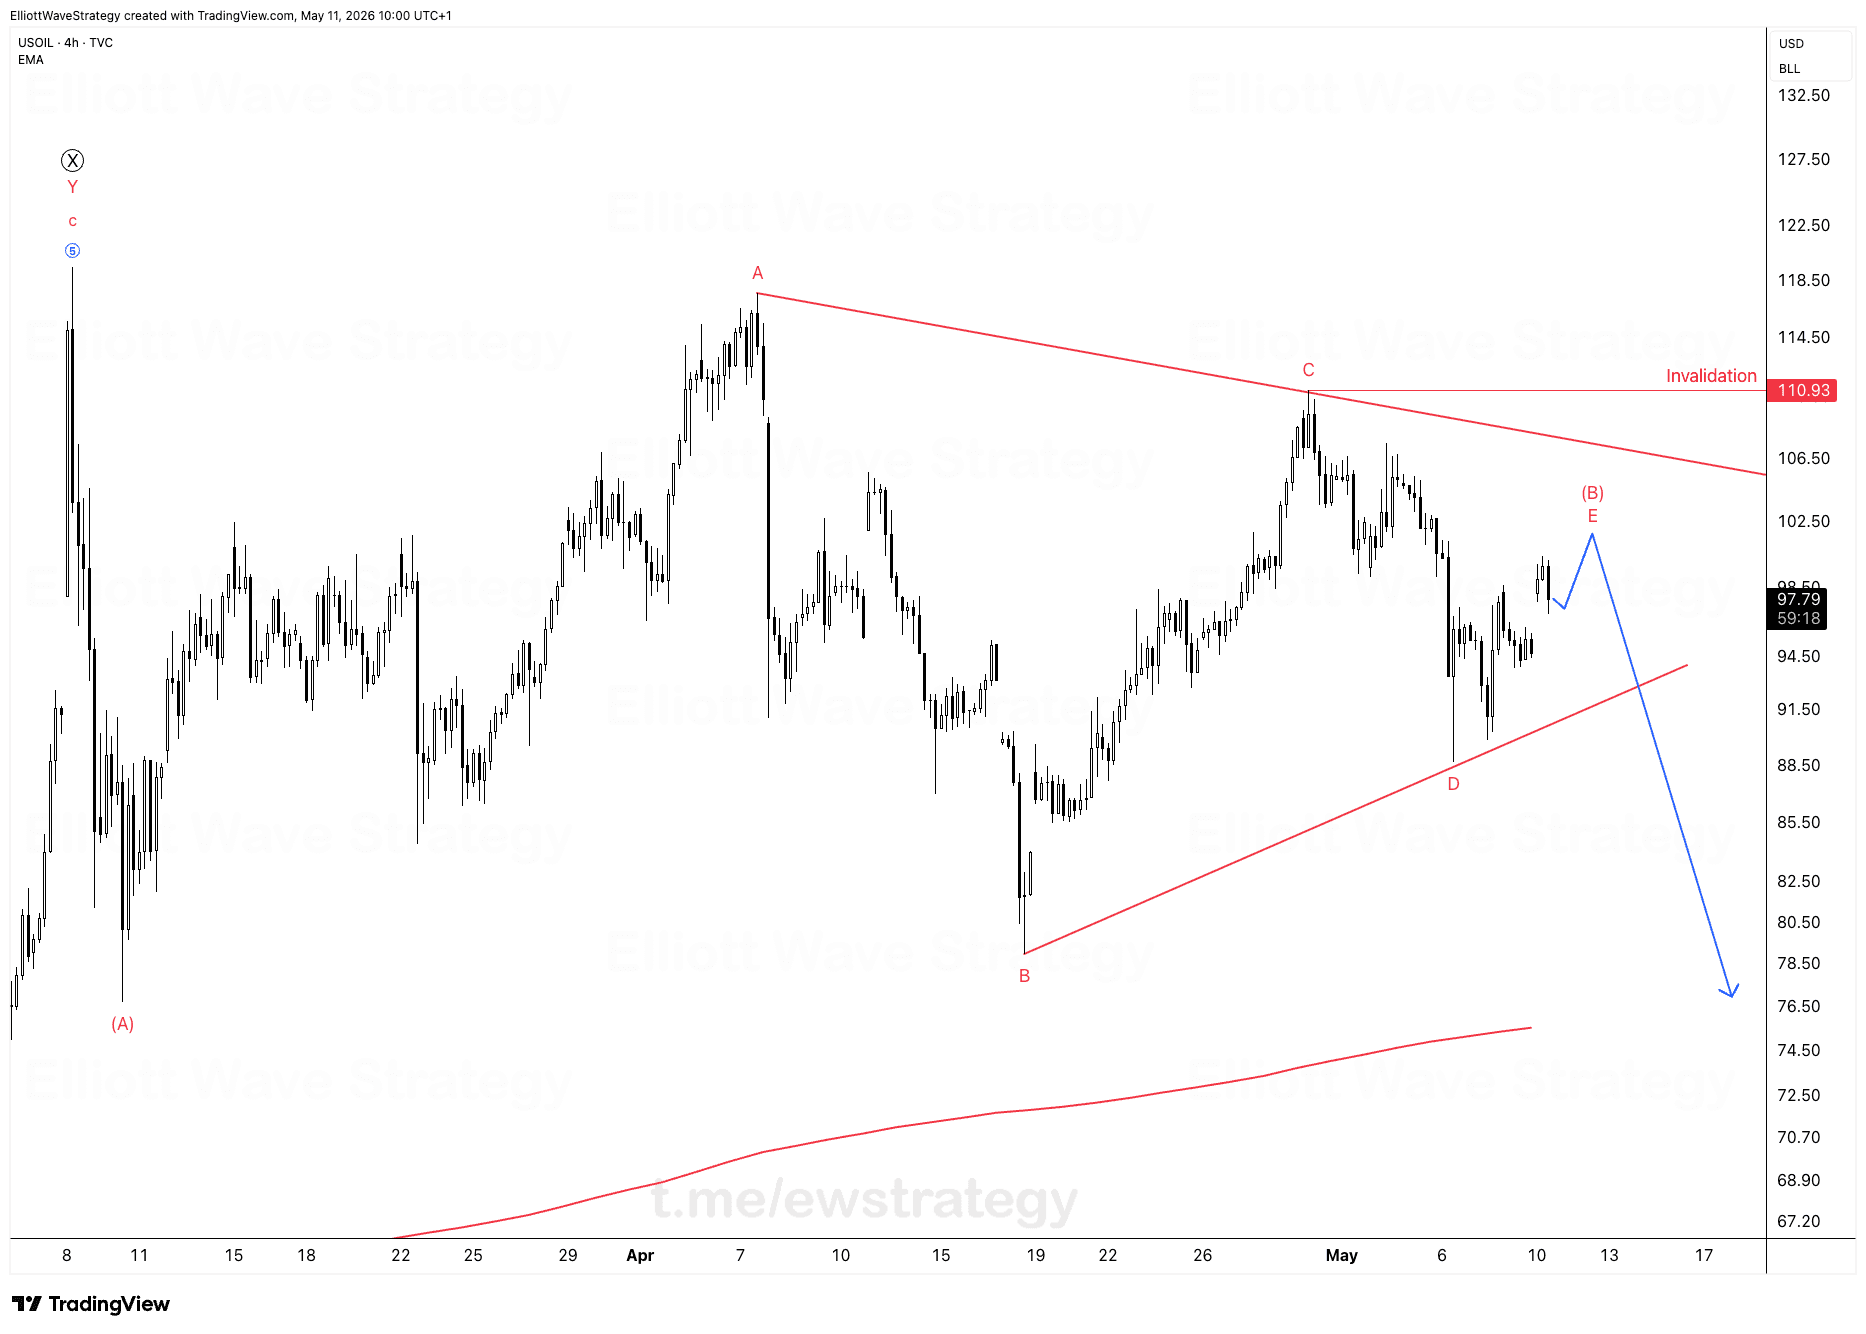
Here's the part traders tend to skip past: this could be the final leg of a larger correction, not the start of a fresh bull trend. Look at the bigger picture on the chart. The move labeled 5 (C) back in July, followed by A, B, and now this advance toward a possible C wave, points to a corrective structure playing out on a higher degree, not a straightforward impulsive rally.
A market can grind higher for weeks and still be corrective underneath. Price going up doesn't automatically mean the bigger structure has turned bullish. That distinction matters for anyone assuming new highs mean a new trend has started.
Trading around invalidation, not prediction
We plan around invalidation levels, not predictions. That's the whole approach here. Nobody knows in advance whether oil prints 114.60, stretches to 118.24, or breaks 101.21 and forces a different map entirely.
What you can do is define the level that breaks the current idea and watch how price reacts around it. Save the chart. Watch how USOIL behaves above or below 101.21, because that reaction will tell you more than any target ever will.
Key Takeaways
- •USOIL holding above 101.21 keeps the wave v bullish scenario intact toward 114.60.
- •A stretch target for USOIL sits at 118.24 if momentum extends past the first objective.
- •A break below 101.21 in USOIL invalidates the current short-term wave count and calls for a revised structure.
- •The rally in USOIL could represent the final leg of a larger correction rather than a new bull trend.
- •Price rising doesn't confirm a bullish structure underneath, the wave count matters more than direction alone.
Frequently Asked Questions
What invalidates the bullish USOIL wave count?
A break below 101.21 invalidates the current wave v scenario and means the short-term structure needs to be revised.
What are the upside targets for USOIL if the wave v count plays out?
The first target is 114.60, based on the 1.0 extension. A stretch target of 118.24, the 1.272 extension, comes into play if momentum continues beyond that.
Does a higher oil price confirm a new bull trend?
Not necessarily. The current advance could be the final leg of a larger corrective structure rather than the start of a fresh bull trend, since a market can grind higher while remaining corrective underneath.
Disclaimer: This analysis is for educational purposes only and does not constitute financial advice. Elliott Wave analysis involves subjective interpretation. Always do your own research and manage your risk accordingly.
Get Full Coverage for All 27 Instruments
Premium members receive daily wave counts with entry zones, targets and invalidation levels, published daily across all 27 instruments.
View Premium Plans