XAUUSD Elliott Wave: Head and Shoulders or Bigger Rally?
Blue or Red? Gold bounced right where we flagged it in our last update. A bounce alone doesn't tell you what's next though, just that the market reacted.
Gold bounced right where we flagged it in the last update. That's the easy part. A bounce alone doesn't tell you what happens next, it just tells you the market reacted at that spot. What matters now is which of the two paths gets confirmed first.
XAUUSD is trading right at the pivot between a bullish continuation and a bearish reversal. Both counts are still valid. Both have a clean invalidation level. This is exactly the kind of moment where traders start picking a side out of hope instead of structure, and that's the mistake we're trying to avoid here.
What is the bullish scenario for XAUUSD right now?
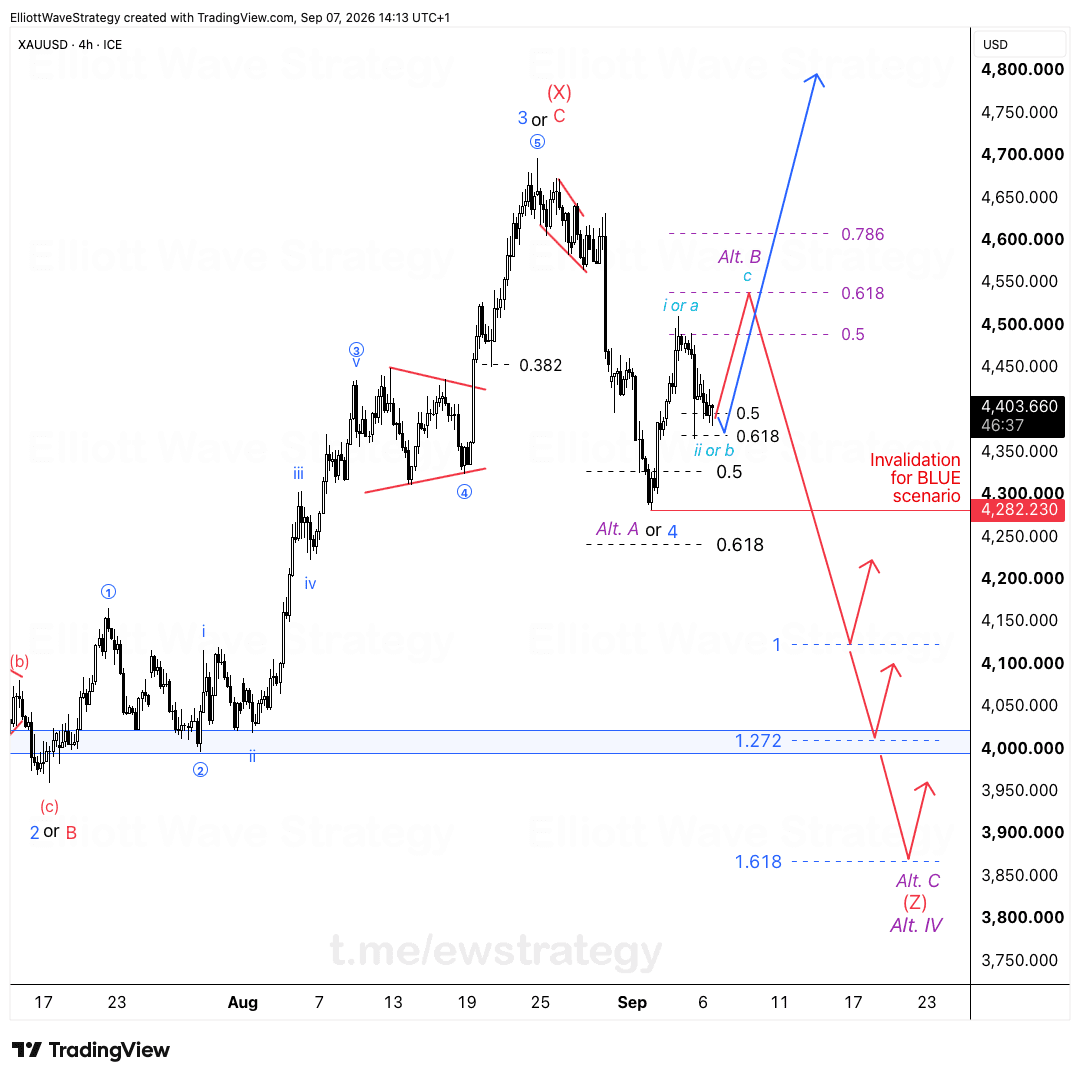
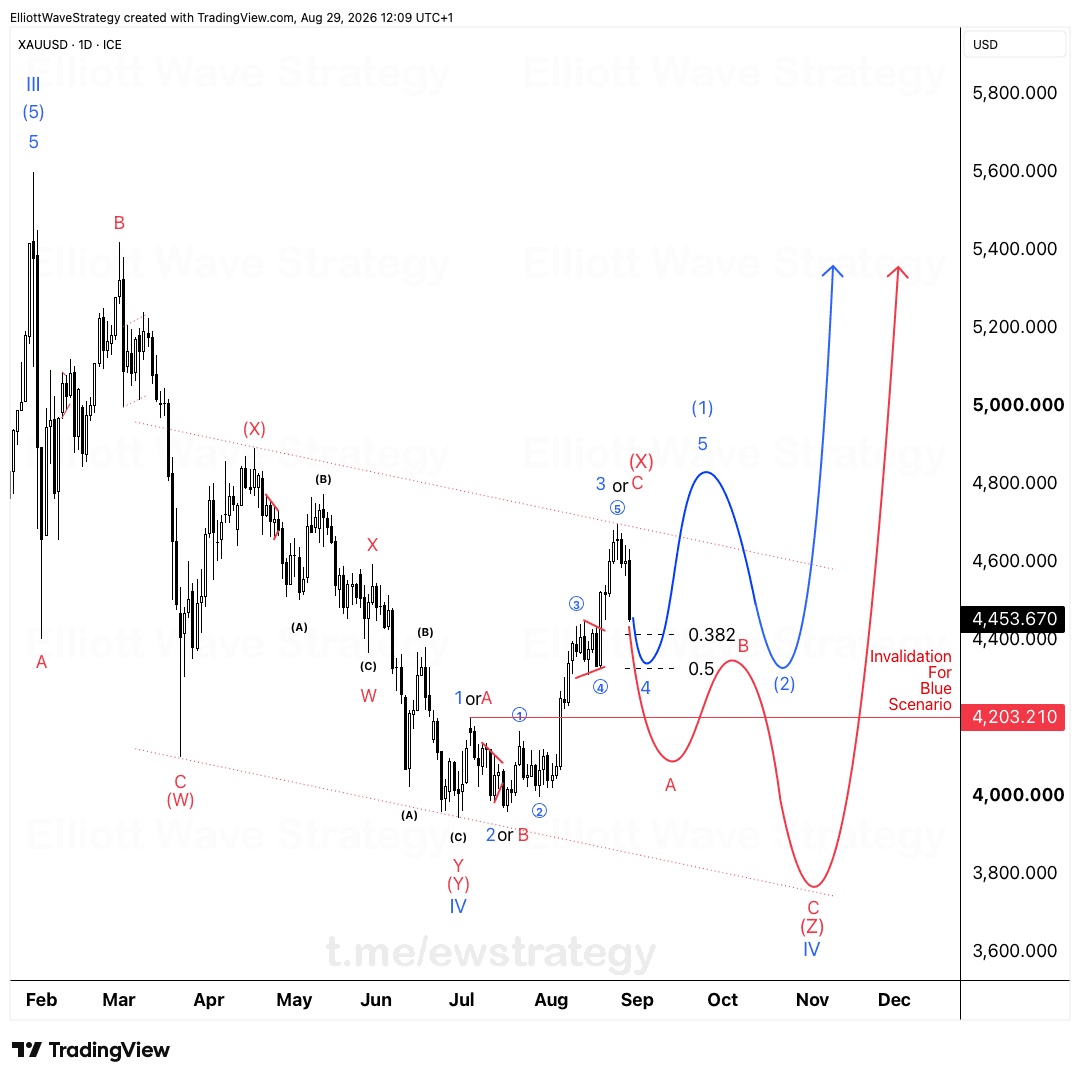
The blue path treats this bounce as Alt (ii), a pullback inside a bigger recovery. If price respects the 0.5 to 0.618 retracement zone on this leg down and holds above it, gold is set up to push back toward new local highs above the prior swing near 4,600 and beyond.
The chart shows wave (i) or Alt A already printed lower, followed by this current bounce labeled Alt (ii). A clean hold in the 0.5-0.618 pocket is the tell. If sellers can't break through that zone, the path of least resistance stays up.
Invalidation for this scenario sits at 4,234.68. A break below that level kills the bullish continuation idea outright, no matter how good the bounce looks in the short term.
What does the head and shoulders top mean for gold?
The red scenario reads the entire structure since the (X) high as a head and shoulders top. Look at the chart: left shoulder, head at the 3 or C peak near 4,760, right shoulder forming with the Alt B or 2 bounce, and a neckline running underneath both shoulders.
If that neckline break is genuine, the current bounce is nothing more than Alt B or 2, a corrective rally before the next leg down toward Alt C or (i). That leg, per the chart's drawn trajectory, points toward the 4,000 region and the wave (iii) territory marked at the bottom.
Invalidation for the red scenario is 4,510.90. A move above that level and the head and shoulders top stops being a valid read.
How do you know which XAUUSD path is playing correctly right now?
You don't guess, you watch the next pullback. If gold respects the 0.5-0.618 zone and holds above 4,234.68, blue gains weight. If it breaks 4,234.68 first, red takes over and the neckline break gets validated.
The two invalidation levels, 4,234.68 for blue and 4,510.90 for red, box in the entire debate. Whichever one gets tested first tells you which structure the market is actually respecting, not which one you were hoping for.
Gold sits at a genuine fork here. Save this chart, compare it against the next update, and let the invalidation levels do the talking instead of the chart pattern you personally prefer.
Key Takeaways
- •XAUUSD bounced exactly at the level flagged in the prior update, but the bounce itself doesn't confirm direction.
- •The bullish XAUUSD count treats this move as Alt (ii) inside a larger recovery, targeting new local highs if the 0.5-0.618 zone holds.
- •The bearish count reads XAUUSD as a head and shoulders top, with this bounce as Alt B or 2 before a drop toward Alt C or (i) near 4,000.
- •4,234.68 invalidates the bullish scenario for gold, while 4,510.90 invalidates the bearish head and shoulders scenario.
- •Both Elliott Wave paths remain valid until one invalidation level is tested, so the next pullback structure decides which side is correct.
Frequently Asked Questions
What invalidates the bullish XAUUSD Elliott Wave count?
A break below 4,234.68 invalidates the bullish scenario, meaning the pullback failed to hold as Alt (ii) and the recovery structure is off the table.
What invalidates the bearish head and shoulders scenario in gold?
A move above 4,510.90 invalidates the head and shoulders top, since that level sits beyond what the corrective Alt B or 2 bounce should reach if the topping structure is real.
Why hasn't Cetin picked a side on XAUUSD yet?
Both the bullish and bearish counts remain structurally valid with clear invalidation levels, so the next pullback's behavior, not a preference, will show which path the market is actually respecting.
Disclaimer: This analysis is for educational purposes only and does not constitute financial advice. Elliott Wave analysis involves subjective interpretation. Always do your own research and manage your risk accordingly.
Get Full Coverage for All 27 Instruments
Premium members receive daily wave counts with entry zones, targets and invalidation levels, published daily across all 27 instruments.
View Premium Plans