

Anatomy of Five Crashes
1987, 2000, 2008, 2020 and 2022 are not five versions of the same event. Who was forced to sell sets the tempo, the tempo sets the corrective form, and the form decides whether your invalidation
Quick answer: 1987, 2000, 2008, 2020 and 2022 are five different objects that share a word. What separates them is who was forced to sell and on what clock. A rule-based seller with no discretion produces a near-vertical leg that ends as abruptly as it starts. A market with no forced seller at all produces an overlapping grind that offers you a new reason to change your mind every few weeks. Those are different corrective forms, and the practical difference is what each one does to an invalidation level: tested once, never tested, or broken shallowly four times and reclaimed.
Every generation of traders gets taught crash history as a list of dates and percentages, which is the least useful way to hold it. The numbers are memorable and they tell you nothing about what to do while one is happening.
What is useful is structural. A decline that resolves in weeks and one that grinds for years are not the same shape drawn at different speeds. They are different corrective forms, with different rules about overlap, different subdivision, and different behaviour around the level where your count dies. You will not find a percentage, a date or a duration below. Those need the measured data series, and the argument does not depend on them.
Five crashes, five different objects
Take the five as separate species rather than five sizes of the same animal.
The word crash does a lot of unearned work. It groups a single-session mechanical break with a multi-year repricing of a whole sector, and both of those with a repricing driven by nothing more dramatic than a moving risk-free rate. Carry one mental template for all of them and four out of five will surprise you.
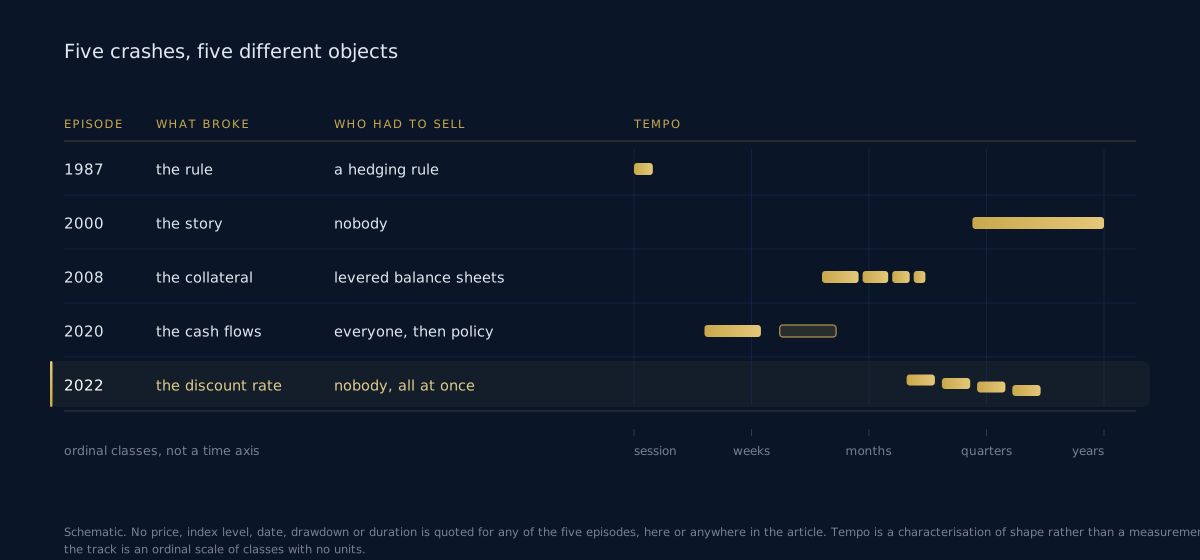
| Episode | What broke | Who had to sell | Tempo |
|---|---|---|---|
| 1987 | the rule | a hedging programme, selling because price fell | one session |
| 2000 | the story | nobody, and that is the point | years |
| 2008 | the collateral | levered balance sheets meeting funding calls | months, accelerating |
| 2020 | the cash flows | everyone at once, then a policy buyer of matching size | weeks down, weeks back |
| 2022 | the discount rate | nobody; every asset repricing against a moving rate | quarters, stair-stepped |
Tempo there is a class, not a measurement. I am describing shape, not reading a stopwatch.
What actually broke each time
1987 was a feedback loop. Hedging programmes were built to sell as price fell, price fell, and so they sold, which made price fall. Nobody had to be wrong about anything. The mechanism ran until it ran out, and it did not need a second day.
2000 was an abandoned story. Nobody was forced to do anything. A valuation regime that had made sense to a lot of people stopped making sense, gradually, sector by sector, with a rolling top rather than a single high. The hardest of the five to trade, because there is no moment.
2008 was a collateral chain. Levered institutions sold what they could rather than what they wanted, and each round of selling created the next round of calls. The same arithmetic as a margin call on one book, run across a system.
2020 was an external stop. Real cash flows were interrupted by something with nothing to do with markets, then met by a policy response of comparable size and speed. Both the seller and the buyer arrived from outside the price mechanism.
2022 was arithmetic. The risk-free rate moved and everything priced off it repriced. No panic, no forced seller, no failure of any institution. Just a denominator changing under every valuation at once.
Who has to sell decides how fast it happens
This is the engine of the whole argument, so it is worth stating plainly.
A seller with a deadline compresses the move. A margin clerk gives a number and a time, and the selling that follows is a fixed quantity that has to be gone by Friday. Enormous, one-directional, finished. That produces a leg which is nearly impossible to subdivide, because one kind of order produced all of it.
A seller with no deadline stretches the move. When people are reconsidering rather than being liquidated, the selling arrives as allocation decisions spread across quarters, each interrupted by somebody else's decision going the other way. That produces overlap, and overlap is the structural signature of a correction.
So the first question in a decline is not where it ends. It is whether anybody has a deadline. You can usually answer that on day one, from funding spreads and from whether unrelated assets are falling together.
Fast and slow are different corrective forms
Now the structural part, and this is where Elliott earns its keep.
A fast crash resolves as a sharp form. Three legs, no overlap between the first leg's territory and the connecting rally, a terminal leg that runs further than looks reasonable, and then it stops. Label it a zigzag at one degree or the third of an impulse at another; the practical character is the same. It completes soon enough that you get one decision to make.
A slow crash resolves as a combination. W, X, Y, sometimes another X and a Z. Each connecting rally retraces enough of the previous leg to look like a bottom, and the structure can spend quarters going nowhere while grinding lower. Nothing exotic about it. It is the form a market takes when nobody is being forced.
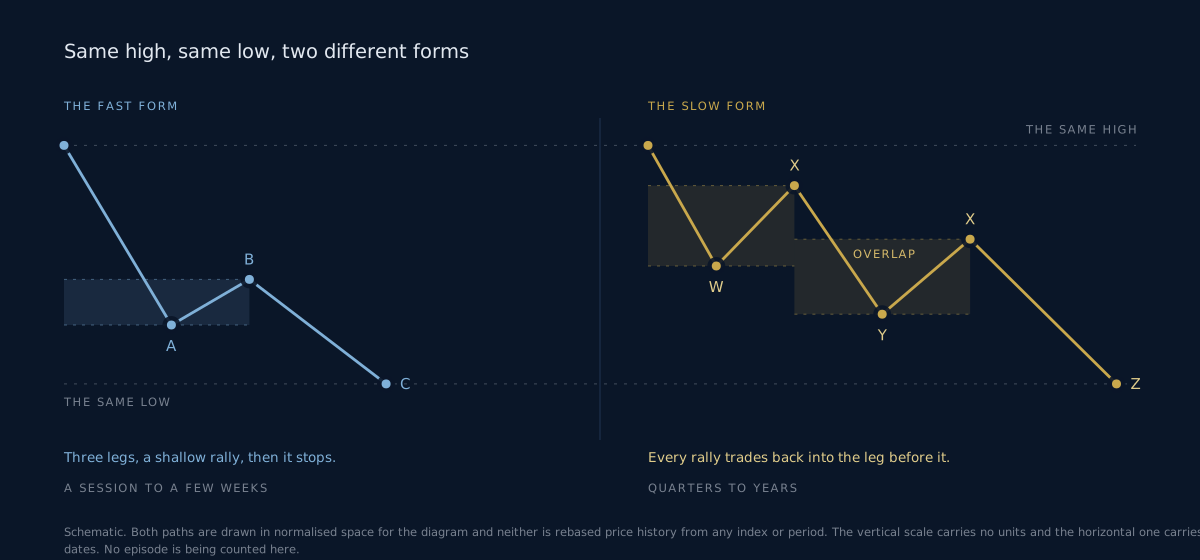
| The fast form | The slow form | |
|---|---|---|
| Produced by | a seller with a deadline | a market changing its mind |
| Legs you have to label | few | many, and each one plausibly the last |
| Overlap | absent, which is the tell | constant, which is also the tell |
| Subdivision at lower degree | often refuses to subdivide cleanly | subdivides into threes all the way down |
| Number of decisions it asks of you | one | one a month |
| Cost of being wrong | a stop | a stop, repeated |
Why the slow one costs more
Most traders assume the violent crash is the dangerous one. It is not.
A violent decline is expensive once. You are positioned wrongly, the market says so inside a week, and you either took the loss or you did not. The information arrives fast and cheap. Painful, over, filed.
A grind is expensive repeatedly. Each X wave hands you a fresh and credible reason to think the low is in. You act, the structure resumes, you are stopped, and the next X wave arrives with a better story because now there is a higher low behind it. Being right about the destination protects you from none of this.
The damage from 2022-style price action does not come from the size of the decline. It comes from the number of times a reasonable person changed a reasonable mind.
What each type does to your invalidation level
The level itself never moves. That is worth saying twice, because the temptation under stress is to treat invalidation as negotiable, and it is not. What changes between the five is how often the market goes anywhere near it.
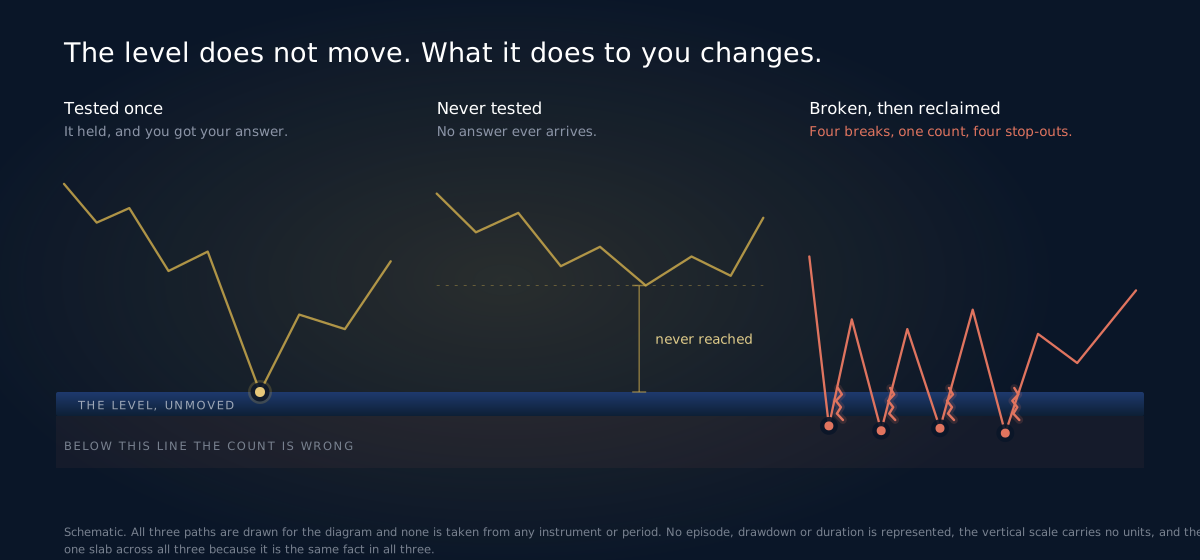
Tested once. The market comes back to your level, touches it, and turns. Take the answer. Put the stop beyond the level and do not widen it while the candle is forming.
Never tested. The market falls away from your level and never returns. This feels like being right and it is the most dangerous of the three, because a count nobody can falsify keeps getting carried. If your invalidation has been unreachable for months, the level has stopped doing any work, and you need a second condition: a time limit, or a requirement that a specific subdivision appears by a specific point.
Broken and reclaimed. The level goes, comes back, goes again. Four shallow breaks, four stop-outs, one count that was correct throughout. The honest responses are to place the stop beyond the whole structure and carry a smaller position, or to stand aside until the form completes. Moving the level after the fact is not one of them.
Reading a crash while it is still going
Four checks, in the order they become available.
Did unrelated things fall together? Assets with no economic relationship declining in the same session is the signature of a funding event rather than a repricing. That is the fast form, and the invalidation level will be tested soon.
Is there overlap yet? The most useful structural question in the first fortnight. A decline whose second leg trades back into the territory of the first is telling you it is corrective and probably slow. Clean non-overlapping legs tell you the opposite.
How does the first serious rally behave? In the fast form it either fails quickly at an obvious level or takes the whole structure back. In the slow form it does neither: it grinds up, clears a resistance level, holds there for weeks, then rolls over. That third behaviour is an X wave, and once you have seen one, expect more.
Is anybody actually being liquidated? Credit spreads and cross-asset correlation answer this in real time. The absence of forced selling is not reassuring. It usually means the decline has no natural end date.
Where this framework fails
Three honest limits, and the first is the one that matters.
The mapping from mechanism to corrective form is a tendency, not a rule. A funding event can resolve into a combination if a policy response interrupts it halfway. A slow repricing turns into a liquidation the moment somebody levered gets caught in it. This is a prior, and priors get updated by the tape rather than defended against it.
Second, all five are legible in hindsight and the mechanism is far less obvious while it runs. In the first week of a decline you will have three plausible mechanisms and no way to choose between them.
Third, none of it gives you a level. Corrective form constrains shape and constrains where a count fails. It says nothing about where the low prints, and anything claiming to do both is claiming too much.
The rule that survives all five
Whatever the mechanism, the rule book does not bend. Overlap still forbids an impulse. A three still cannot be relabelled a five because the move was violent. A wave four still cannot enter wave one's territory, and no headline explains that away.
What the mechanism buys you is expectation management. Knowing you are probably in a combination changes how you size, how long you expect to wait, and how many stop-outs you accept before concluding the count is wrong rather than the position. Knowing you are in a liquidation changes almost nothing about the count and a great deal about the week.
Carry both frames, separately. The count says what shape this is and where the reading breaks. The mechanism says how the market will treat that break.
Quick facts
- No drawdown percentage, date, index level, duration or recovery length for any of the five episodes appears in this article. Those need the measured data series.
- Tempo is written as a class throughout: a session, weeks, months, quarters, years. Those are characterisations of shape, not measurements.
- 1987 was a feedback loop between price and a rule-based seller, which is why it needed no second day.
- 2000 had no forced seller at all, which is why it had no single moment and no clean high.
- 2008 was a collateral chain, and the same arithmetic as a margin call on one book, run across a system.
- 2020 had an exogenous seller and an exogenous buyer of comparable size, which is why the shape runs forwards and then backwards.
- 2022 was a denominator changing under every valuation at once, which produces overlap rather than panic.
- The expensive form is the one that breaks your invalidation level shallowly and repeatedly, not the one that falls fastest.
Frequently asked questions
Which of the five is the closest template for the next one? None, and picking a favourite is the standard way to be wrong. Identify the mechanism early instead of pattern-matching the chart to a remembered episode. Two declines can look identical for a fortnight and then separate completely, because what separates them is who has a deadline.
Can a crash be an impulse rather than a correction? Of course, and at a large enough degree several of these read better that way. The distinction here is about the character the mechanism produces, not the label. A liquidation leg resists clean subdivision whatever you call it, and a grind subdivides into threes whatever you call it.
How early can you tell fast from slow? Often within days, and not from the index. Watch whether unrelated assets fell in the same session and whether the dollar was bid into it. Both are available in real time and both point at funding rather than at valuation.
Does a violent decline mean a violent recovery? Not reliably, and the episodes people cite for it had a policy response doing the work. What a violent decline does predict is that your invalidation level gets tested soon, which is a claim about information rather than direction.
What should I actually change when I think I am in a grind? Position size and stop placement, in that order. Carry less, put the stop beyond the whole structure rather than beyond the nearest swing, and set a rule in advance about how many stop-outs on one count you will accept before standing aside. Three is a reasonable number to write down before you need it.
Why refuse to quote the numbers at all? Because a drawdown figure quoted from memory is a fabricated number wearing a real one's authority, and because the argument does not need it. When the measured series are added, the numbers drop in alongside these maps and nothing above them changes.
THE MECHANISM SETS THE TEMPO. THE TEMPO SETS THE FORM. EW Strategy publishes daily Elliott Wave analysis across 27 instruments, 11 FX pairs, 4 commodities, 5 indices and 7 crypto, on H4, Daily and Weekly. Annotated PDF reports on US500, US100 and the index complex, EWS Helix on WhatsApp when a level goes at three in the morning, and the position sizing and risk and reward calculators for the part of this that is arithmetic rather than judgement.
Further reading
Frequently asked questions
What is Elliott Wave analysis?+
Elliott Wave analysis is a form of technical analysis based on the theory that financial markets move in predictable wave patterns reflecting crowd psychology. Markets advance in five-wave impulse patterns and correct in three-wave patterns.
How accurate is Elliott Wave analysis?+
Accuracy depends on the analyst's skill, the instrument, and how the result is measured. At EW Strategy, every published call carries a direction, target levels and an invalidation level stated in advance, and every outcome is recorded against them. We are rebuilding that record from the raw archive under a measurement rule published before any figure, and we would rather show nothing than a headline number we cannot defend.
Can Elliott Wave analysis be used for day trading?+
Yes. Elliott Wave patterns appear at all timeframes, from 1-minute charts to monthly charts. Day traders typically focus on sub-minuette and minuette degree waves for intraday setups.
Elliott Wave analyst with 15+ years of experience. Covers 27 instruments daily across Forex, Commodities, Indices and Crypto. Founder of Artavest Oy, Helsinki.