DXY Elliott Wave: Resistance Decides Wave (B)
I still expect the dollar to turn lower, but the confirmation hasn't shown up yet. Price is pushing into the marked resistance zone, so I'm tracking an alternat
I still expect the dollar to turn lower, but the confirmation hasn't shown up yet.
DXY is pushing into the marked resistance zone, and that is where the whole near-term picture gets decided. So I'm tracking an alternative too.
Where is DXY in the Elliott Wave count?
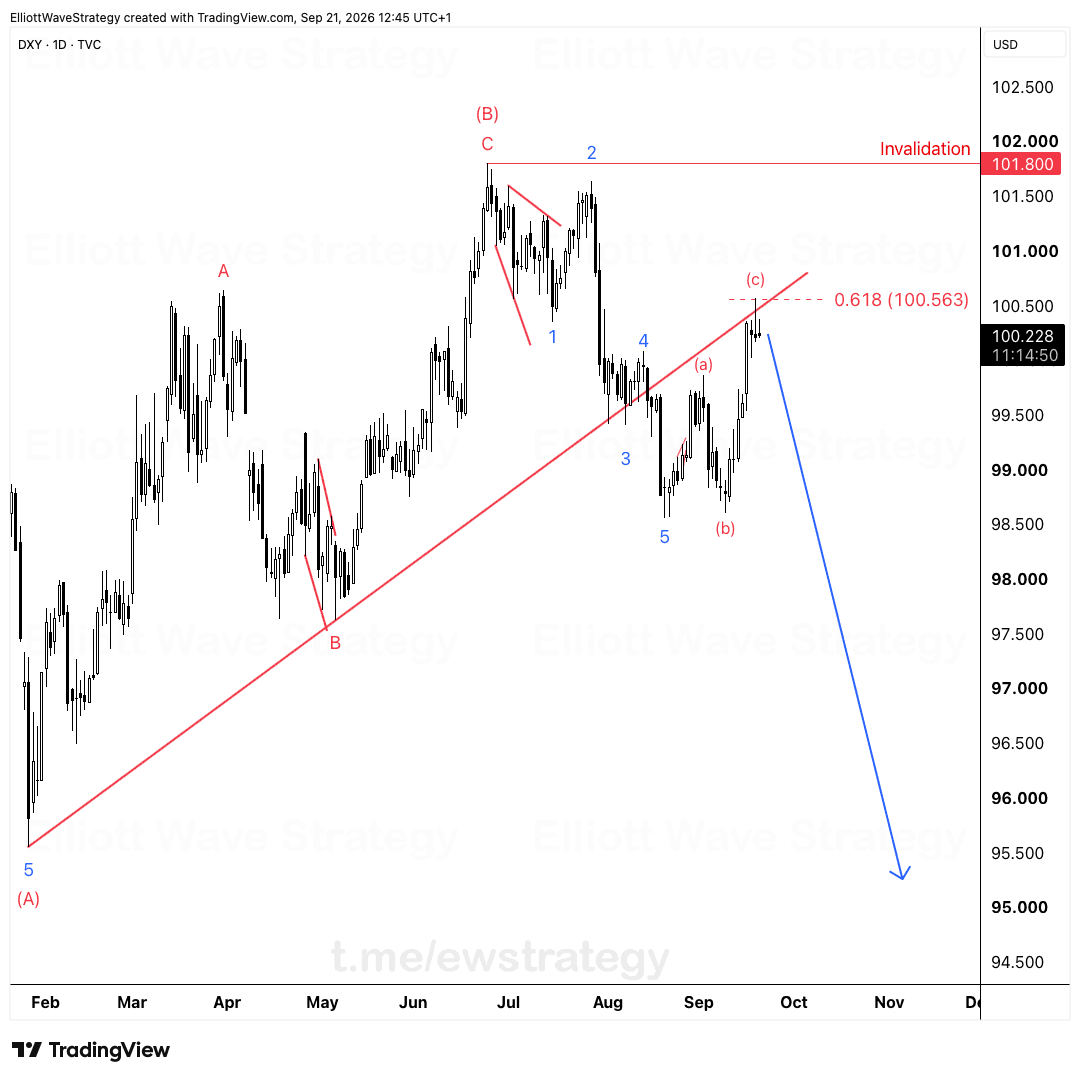
The big picture on the 2-day chart is a completed five-wave decline, labeled 1 through 5 in blue, ending at the 0 level of the Fibonacci grid. That decline is wave (A). Everything since the low is a correction in wave (B).
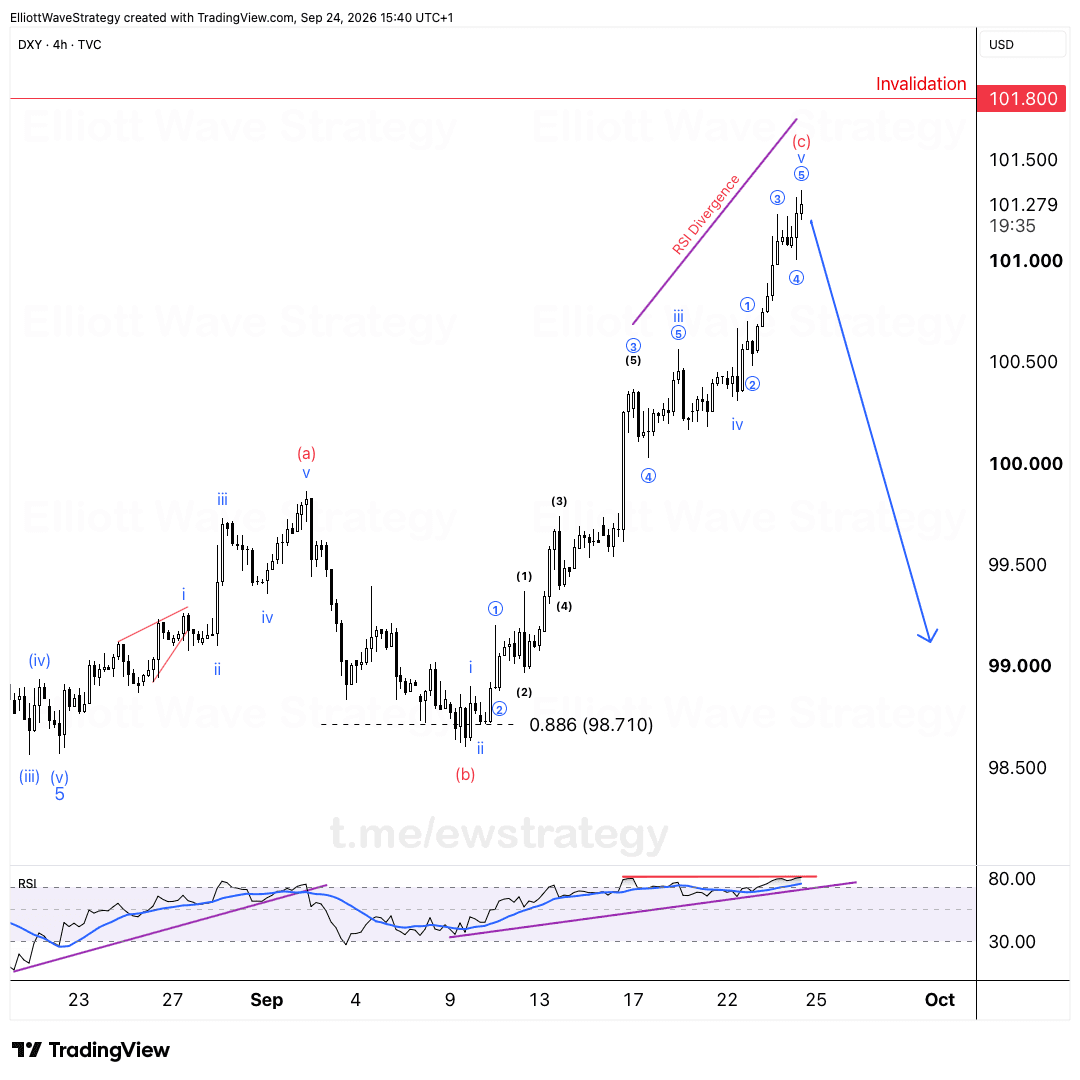
The wave (B) rebound is a complex structure. W, X, Y, X, then Z, the standard double-combination build. The rally off the second wave X low looks like the final wave (c) of Z. If that read is right, wave (B) is close to done and the dollar's larger downtrend resumes.
Why does the resistance zone matter so much for the dollar?
The blue box on the chart is the line in the sand. Price is pushing into it right now, and the bearish count holds only as long as that resistance holds.
A rejection here keeps wave (c) of Z intact and opens the path lower. That is the first scenario, and still my main one. A rejection alone is not confirmation though. I want to see how price reacts at the zone before I trust it.
What happens if DXY breaks above resistance?
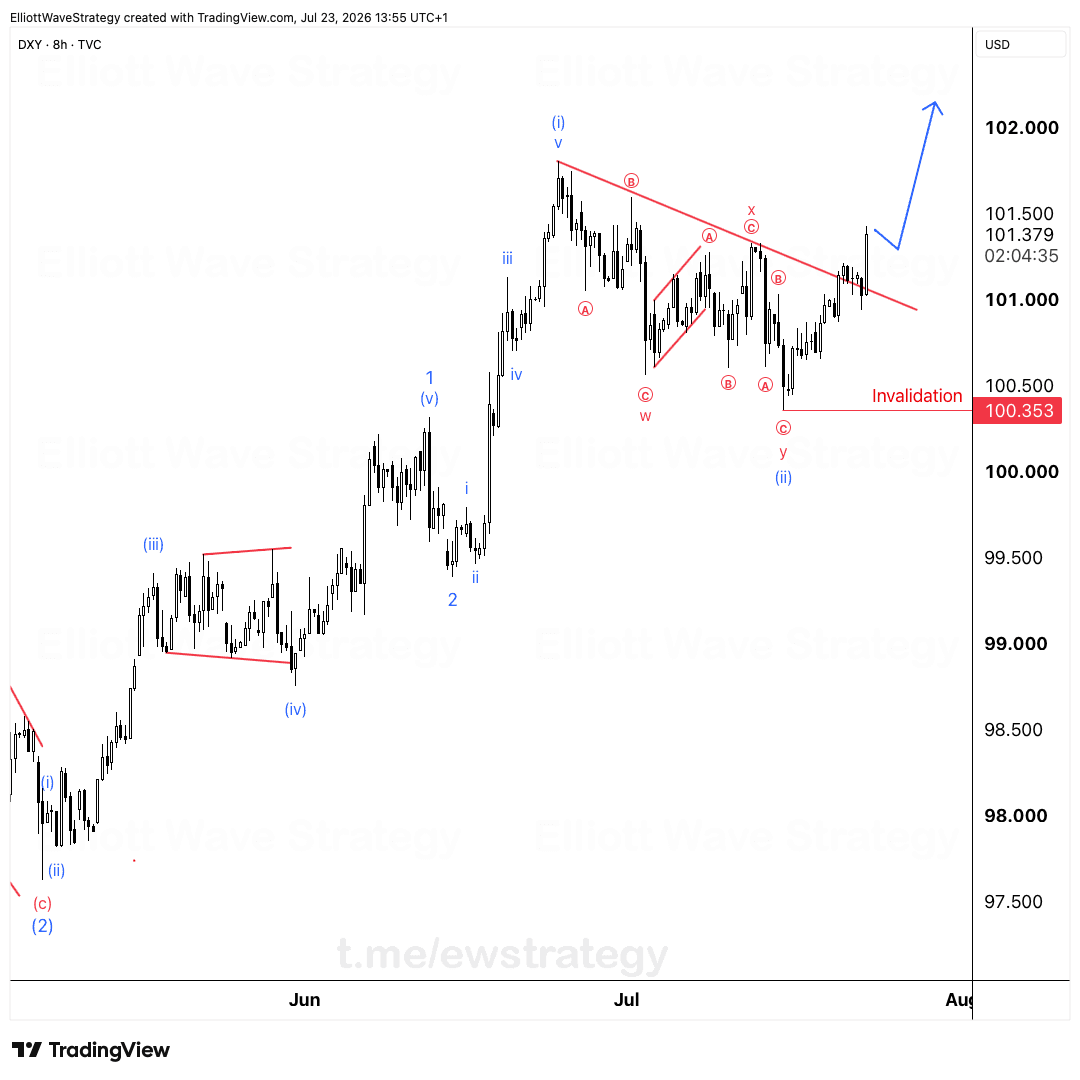
A break above the zone kills my near-term bearish count. No debate, no stretching the labels to save the idea.
If the broken zone then holds as support, the dollar can climb toward the 50-61.8% Fibonacci zone of the prior decline before the downtrend starts. On the chart, those are the dashed levels at 0.5 and 0.618. That is the blue path: higher first, then the turn lower.
So a breakout does not cancel the bigger bearish view. It delays it and gives wave (B) more room.
Why keep two plans on the chart?
Most traders pick one scenario and defend it until the market runs them over. I'd rather have a plan for the decline and a plan for more upside, and let price choose.
The resistance zone is the decision point. Until it breaks or rejects, the work is watching, not guessing.
Key Takeaways
- •DXY is testing a marked resistance zone that decides whether wave (B) is finishing or extending.
- •The current DXY rally off the wave X low is counted as the final wave (c) of Z inside a larger wave (B).
- •A break above the DXY resistance zone invalidates the near-term bearish Elliott Wave count.
- •If DXY breaks higher and the zone holds as support, the 50-61.8% Fibonacci zone becomes the next upside target before the downtrend resumes.
- •The larger DXY picture stays bearish: wave (A) is a completed five-wave decline and wave (B) is the correction.
Frequently Asked Questions
What invalidates the bearish DXY Elliott Wave count?
A break above the marked resistance zone kills the near-term bearish count, which treats the current rally as the final wave (c) of Z. The count holds only as long as that resistance holds.
How high can the dollar index go if resistance breaks?
If DXY breaks above the zone and then holds it as support, the 50-61.8% Fibonacci retracement zone becomes the upside area. The larger downtrend would only start after that move.
Is the DXY downtrend over?
No. The chart shows a completed five-wave decline as wave (A), and the rebound since the low is read as a corrective wave (B). The expected turn lower is not confirmed yet, which is why the resistance reaction matters.
Disclaimer: This analysis is for educational purposes only and does not constitute financial advice. Elliott Wave analysis involves subjective interpretation. Always do your own research and manage your risk accordingly.
Get Full Coverage for All 27 Instruments
Premium members receive daily wave counts with entry zones, targets and invalidation levels, published daily across all 27 instruments.
View Premium Plans