EURUSD Elliott Wave: W-X-Y Correction Targets 1.10
The dollar upside alternative we talked about fits what I'm seeing on EURUSD too. I still think the W-X-Y correction has more room to run. Wave (c) of Y is stil
The dollar upside alternative we talked about fits what I'm seeing on EURUSD too. I still think the W-X-Y correction has more room to run.
The drop to 1.1300 did not finish the job. Wave (c) of Y is still open.
Where does EURUSD stand in the Elliott Wave count?
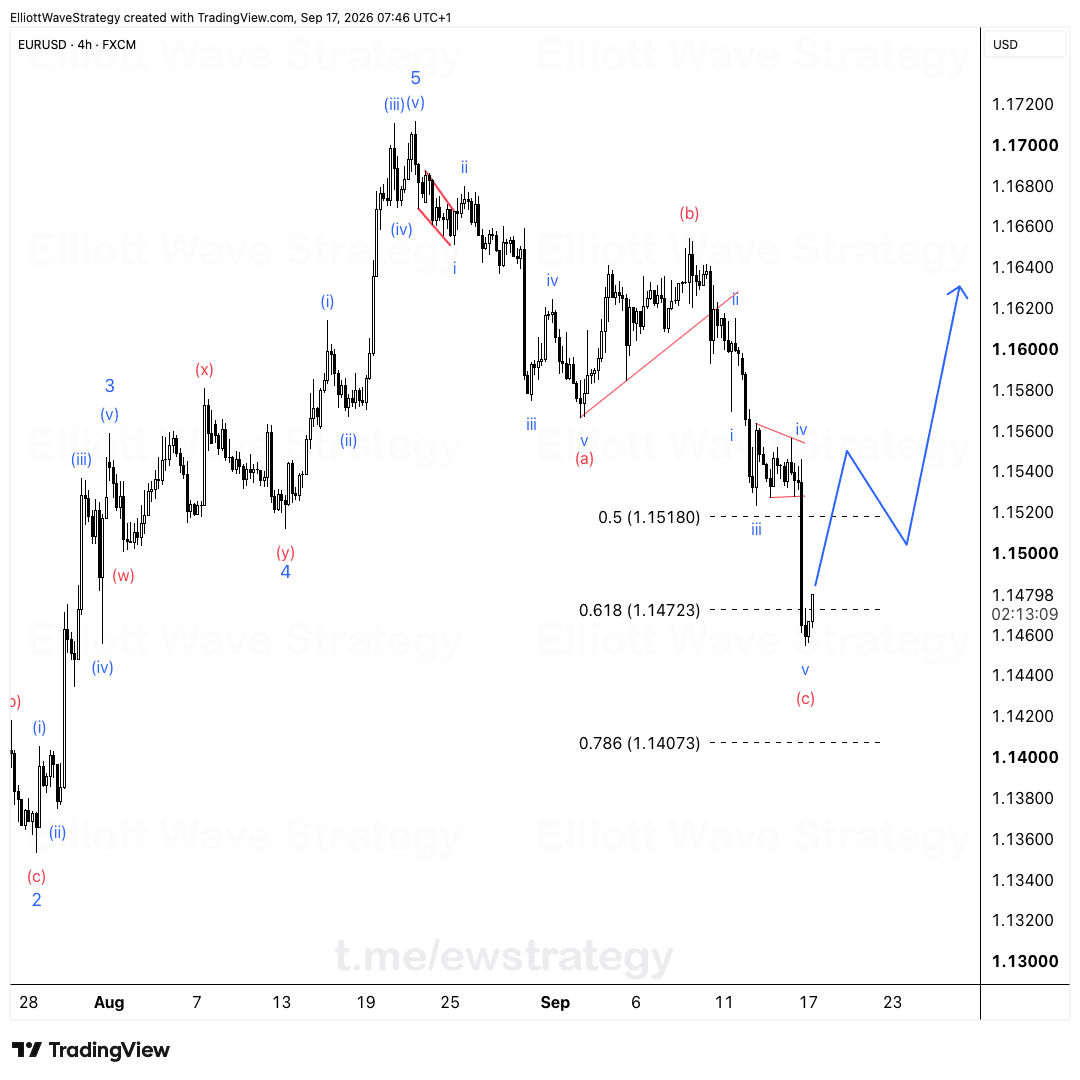
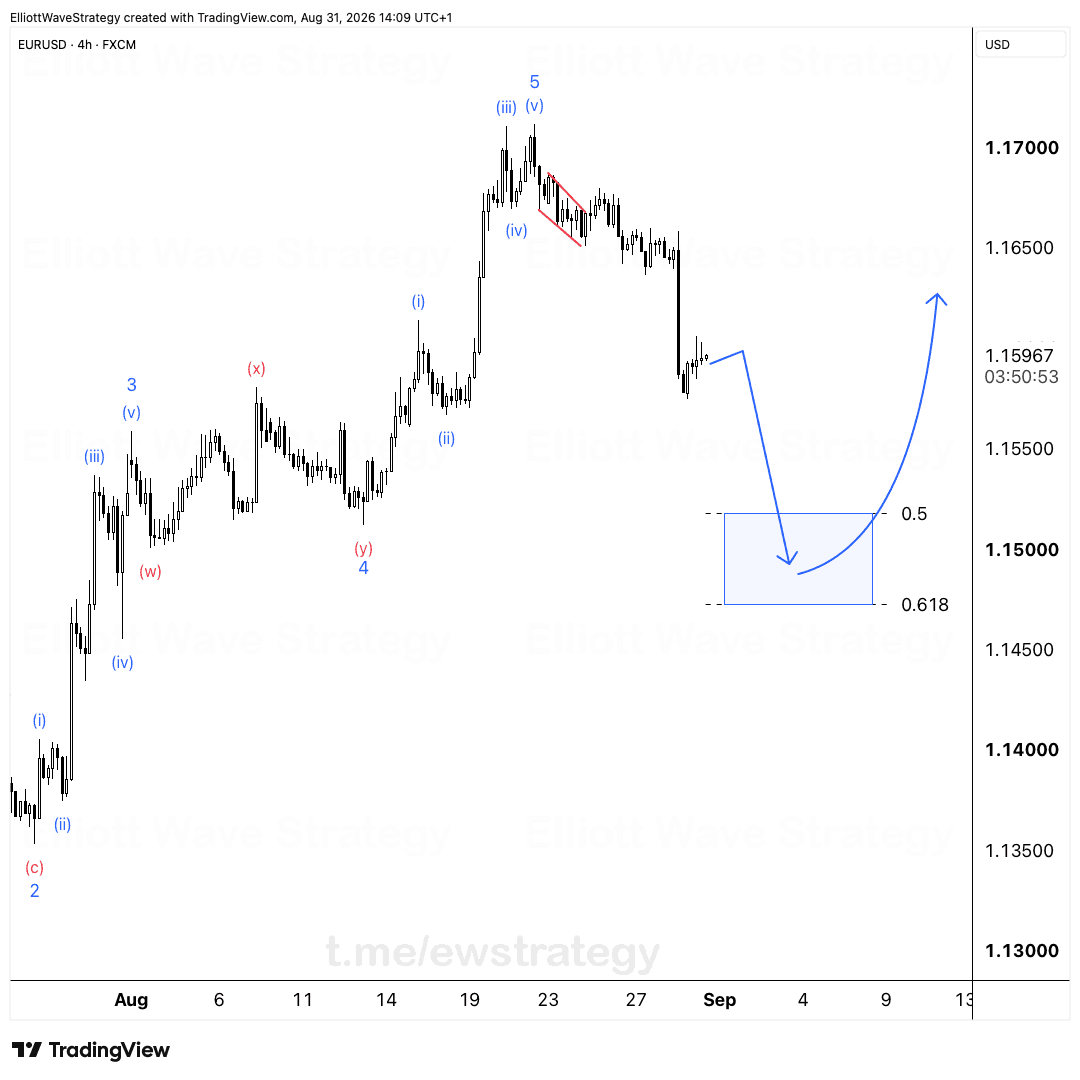
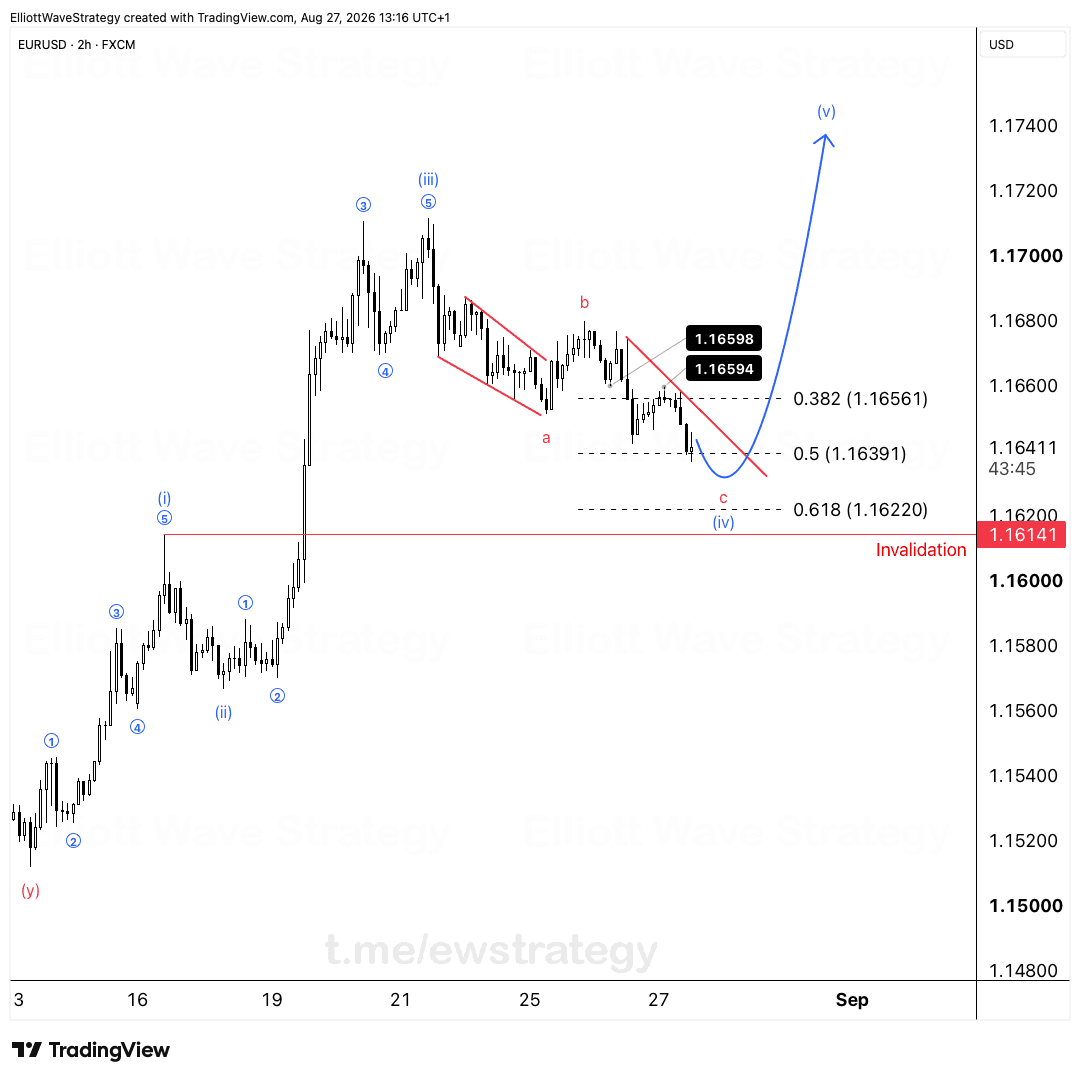
The chart shows a completed five-wave advance into wave (A). Wave 3 of that move ended near the (v) label, then wave 4 built a sideways triangle with its (a)-(b)-(c)-(d)-(e) legs, and wave 5 pushed to the top of (A).
Everything since then is a correction, labeled wave (B). It is a double-three: W, then X, then Y. Wave W finished with its (c) leg, wave X bounced, and wave Y is still being built.
Inside Y, the (a) and (b) legs are done. The (b) leg topped out at the c label in the 1.17 area, and the market has turned down hard from there. That makes wave (c) the active leg, and it is still open at 1.1300.
What are the EURUSD Fibonacci targets for wave (B)?
The 50% retracement of the prior advance sits at 1.1130. The 61.8% retracement sits at 1.0905. The 78.6% level at 1.0585 is the deeper extreme on the chart.
The lower channel line points to 1.10 as well. That is the zone I'm watching for wave (B) to finish.
Two independent tools landing in the same area matters more than any single line. The 50% and 61.8% levels bracket the channel target, and my drawn path for wave (c) runs into that 1.10 region.
Why does the dollar matter for this EURUSD view?
EURUSD is the largest weight in the dollar index, so the two charts tell the same story from opposite sides. If #DXY breaks above 101.80, that backs the bearish EURUSD view.
A dollar breakout would not stop at forex. It could squeeze #XAUUSD too, which is why I read these charts together instead of in isolation.
What would change the EURUSD count?
A correction in wave (B) is not a new downtrend. The larger structure still has a completed five-wave advance behind it, and wave (B) is a counter-move inside that bigger picture.
If price stalls well above the 1.1130 area and reclaims the highs of the (b) leg, the idea of a deep wave (c) loses its footing. I'd then have to rethink whether Y is already done.
Until then, the open wave (c) and the stacked Fibonacci levels define the map. Most traders stare at the last candle. I'd rather know where the correction is allowed to end.
Key Takeaways
- •EURUSD is trading inside a W-X-Y correction labeled wave (B), and wave (c) of Y is still open after the drop to 1.1300.
- •The EURUSD 50% retracement sits at 1.1130 and the 61.8% retracement at 1.0905, with the lower channel line also pointing to 1.10.
- •The zone around 1.10 is where wave (B) of EURUSD is expected to finish in this count.
- •A DXY break above 101.80 would support the bearish EURUSD view and could also squeeze XAUUSD.
- •The EURUSD count rests on a completed five-wave advance into wave (A), which makes the current decline a correction, not a new trend.
Frequently Asked Questions
Where is the EURUSD Elliott Wave correction expected to end?
The zone around 1.10 is the area to watch for wave (B) to finish. The 50% retracement at 1.1130, the 61.8% retracement at 1.0905 and the lower channel line all sit in that region.
What is wave (c) of Y on EURUSD?
Wave Y is the final part of the W-X-Y double-three correction, and wave (c) is its last leg. It is still open after the drop to 1.1300, so more downside is expected before the correction completes.
How does DXY affect the EURUSD Elliott Wave outlook?
A DXY break above 101.80 would back the bearish EURUSD view, since the euro is the largest component of the dollar index. It could also squeeze XAUUSD.
Disclaimer: This analysis is for educational purposes only and does not constitute financial advice. Elliott Wave analysis involves subjective interpretation. Always do your own research and manage your risk accordingly.
Get Full Coverage for All 27 Instruments
Premium members receive daily wave counts with entry zones, targets and invalidation levels, published daily across all 27 instruments.
View Premium Plans