GBPJPY Elliott Wave: Wave 4 Drags On, Wave 5 Still Due
GBPJPY 🇬🇧🇯🇵 (https://s3.tradingview.com/snapshots/g/G4QHUIW7.png)
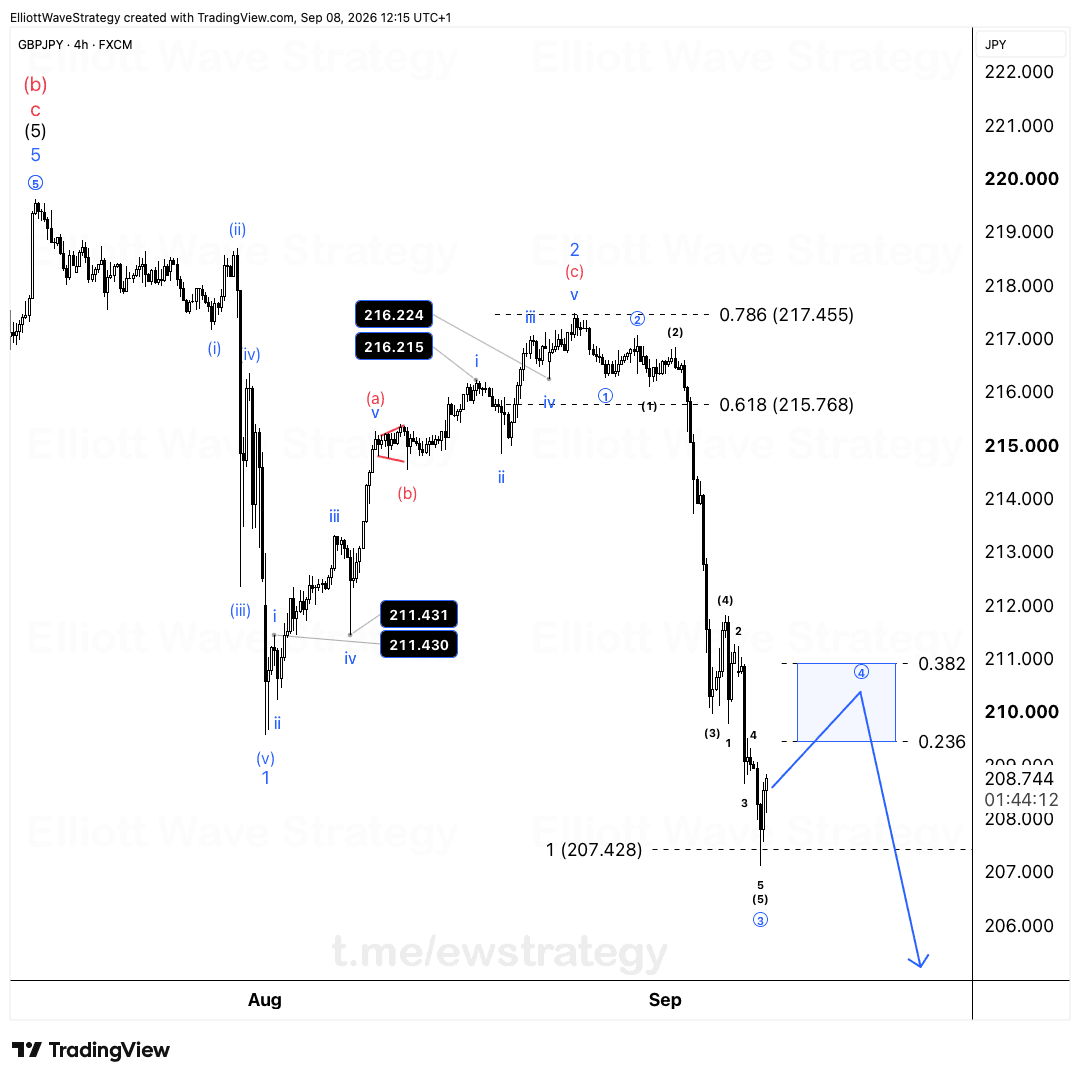
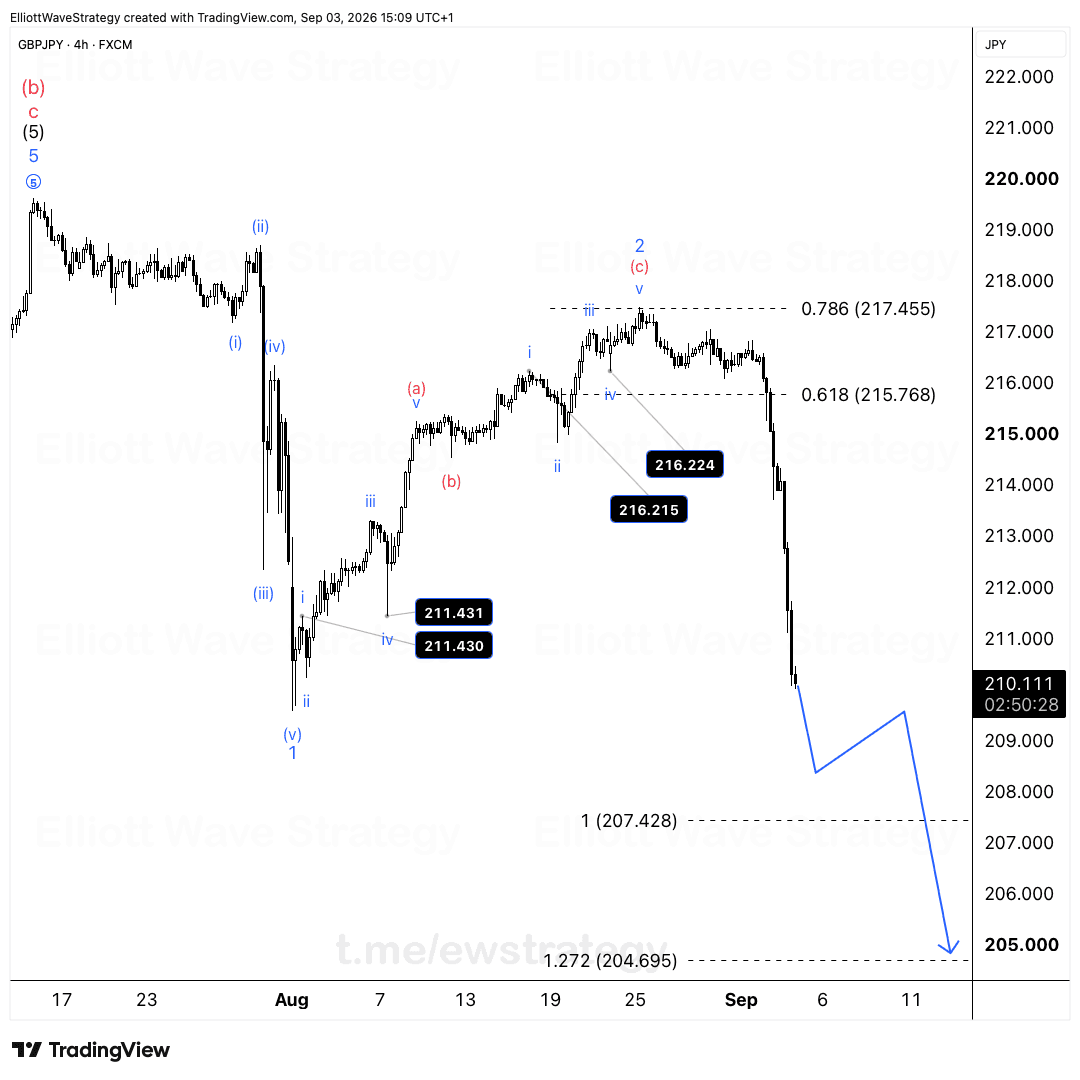
Remember the correction we flagged in our last GBPJPY update? It took a little longer than expected to finish.
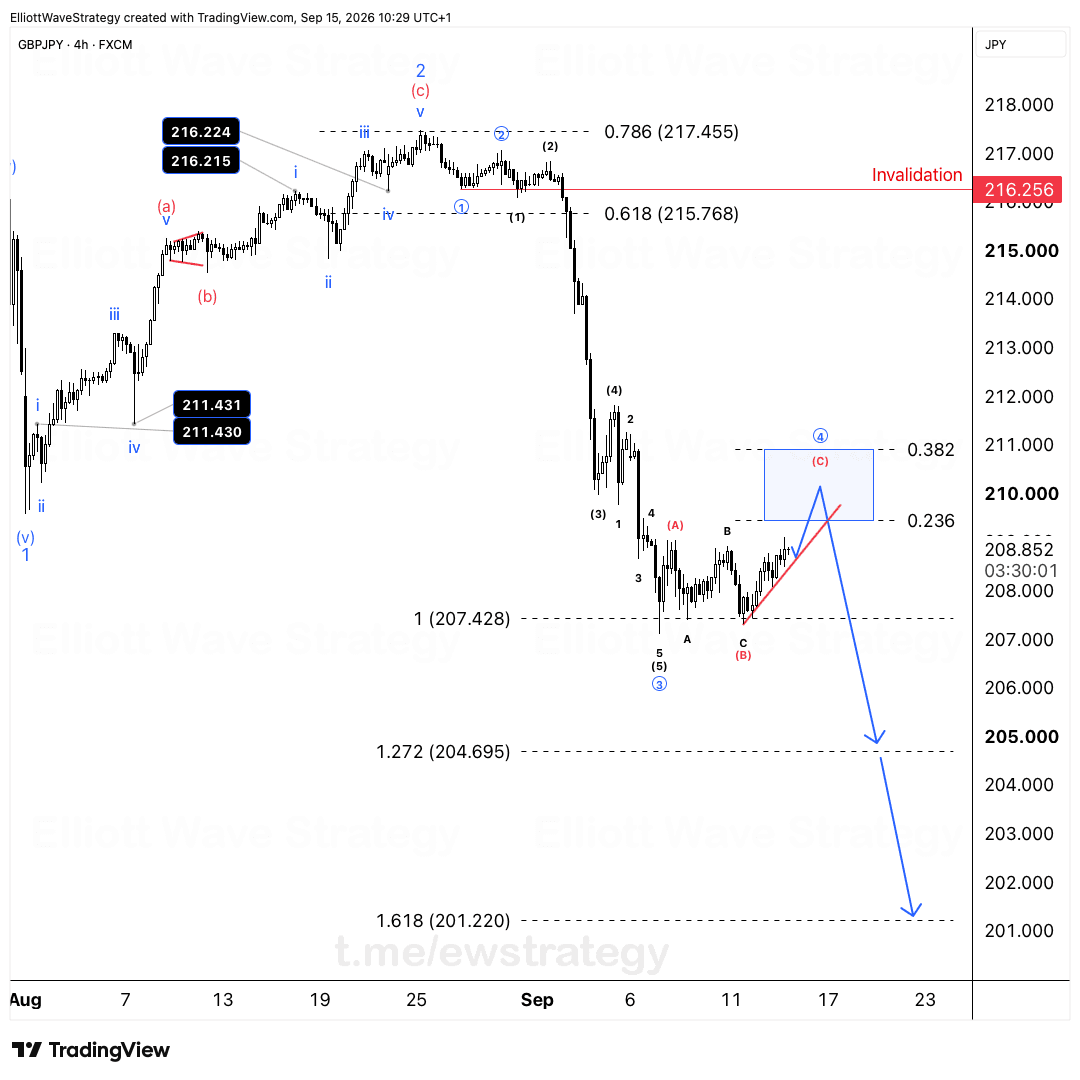
Price pushed slightly above the 0.236-0.382 retracement zone, between 209.45 and 210.90, before turning back down. That overshoot looked uncomfortable if you were watching candle by candle, but it never touched the 211.27 invalidation. Wave (4) just needed extra time to complete. The structure itself never broke.
This is exactly why charts get updated instead of frozen around a first guess. Corrections rarely finish on the first attempt. They stretch, they test the level, and only then do they finish.
The GBPJPY count still calls for another leg lower into Wave 5. The areas being watched next are 207.45 and 205.00.
Why did Wave 4 on GBPJPY take longer to complete?
Wave (4) unfolded as a corrective structure that pushed marginally above the 0.382 retracement at 210.90 before reversing. On a 4h chart this kind of overshoot happens often in corrective waves, especially when Wave (B) inside the correction was itself a contracting triangle, as shown by the converging trendlines on the chart between the (A) and (C) legs.
A triangle in the B position tends to slow price down and inject extra time into the correction. That is what happened here. The move above 210.90 was not a breakout, it was the correction squeezing out its last bit of energy before rolling over. As long as GBPJPY holds below 211.27, the corrective count for Wave (4) remains valid.
What does the 211.27 invalidation level actually mean?
211.27 marks the point where this bearish GBPJPY count would be proven wrong. It sits just above the recent high printed inside the shaded box on the chart, at the top of Wave (4)/wave ④.
As long as price stays under that line, the larger Elliott Wave structure down from wave ② remains intact, and the case for a fifth wave lower stays on the table. A daily close above 211.27 would force a rethink of the entire count.
Where is GBPJPY headed if Wave 5 plays out?
The drawn projection on the chart points toward two zones below current price: 207.45 first, then 205.00. These come from the same Fibonacci framework used to define the Wave 4 retracement zone, extended down for the impulsive fifth wave.
Wave ⑤ would complete a larger five wave decline from wave ②, following waves ①, (1) through (5), ③, and now this extended (4). The five-wave internal structure lower (1 through 5) that preceded the current correction already showed the market's willingness to move fast once the corrective phase ends.
What should traders take from the delayed correction?
The lesson isn't about GBPJPY specifically, it applies to how corrections behave generally. They don't always resolve in a straight line or on schedule.
A correction that takes an extra push above a Fibonacci zone before reversing is still a valid correction, provided the invalidation level holds. Chasing every extension of a correction with a new bearish or bullish bias is how traders get shaken out right before the move they were originally waiting for.
GBPJPY's structure below 211.27 still points down. The next update will confirm whether 207.45 or 205.00 comes first.
Key Takeaways
- •GBPJPY held below the 211.27 invalidation even after pushing slightly above the 209.45-210.90 retracement zone.
- •The GBPJPY Wave (4) correction took longer than expected because Wave (B) formed as a contracting triangle, adding time to the structure.
- •GBPJPY's Elliott Wave count still projects a Wave 5 decline toward 207.45 and then 205.00.
- •A daily close above 211.27 would invalidate the current bearish GBPJPY structure.
- •Corrections often overshoot Fibonacci zones before completing, which is why GBPJPY charts get updated rather than treated as fixed forecasts.
Frequently Asked Questions
What invalidates the bearish GBPJPY Elliott Wave count?
A move above 211.27 would invalidate the current wave (4) count on GBPJPY, since that level marks the top boundary the correction is not supposed to exceed.
Why did GBPJPY's Wave 4 correction take so long to finish?
Wave (4) contained a Wave (B) that formed as a contracting triangle, which typically stretches out the time a correction takes before the next impulsive move begins.
What are the next downside targets for GBPJPY?
The chart projects Wave 5 toward 207.45 first, with 205.00 as the next area being watched if price continues lower.
Disclaimer: This analysis is for educational purposes only and does not constitute financial advice. Elliott Wave analysis involves subjective interpretation. Always do your own research and manage your risk accordingly.
Get Full Coverage for All 27 Instruments
Premium members receive daily wave counts with entry zones, targets and invalidation levels, published daily across all 27 instruments.
View Premium Plans