EURUSD Elliott Wave: 1.1113 Low and the Wave (B) Bounce
Last update I wanted one more drop toward 1.11. Got it. Price hit 1.1113 and reversed hard, which completes wave v of (c) of Y, and that's also wave (B).
Last update I wanted one more drop toward 1.11. Got it. EURUSD hit 1.1113 and reversed hard.
That move completes wave v of (c) of Y, and it also completes wave (B). I'm not calling the low yet, though. The bounce has already broken out of the ending diagonal, but US data lands later today and I'd rather let the chart confirm it first.
Why does the 1.1113 low complete wave (B) on EURUSD?
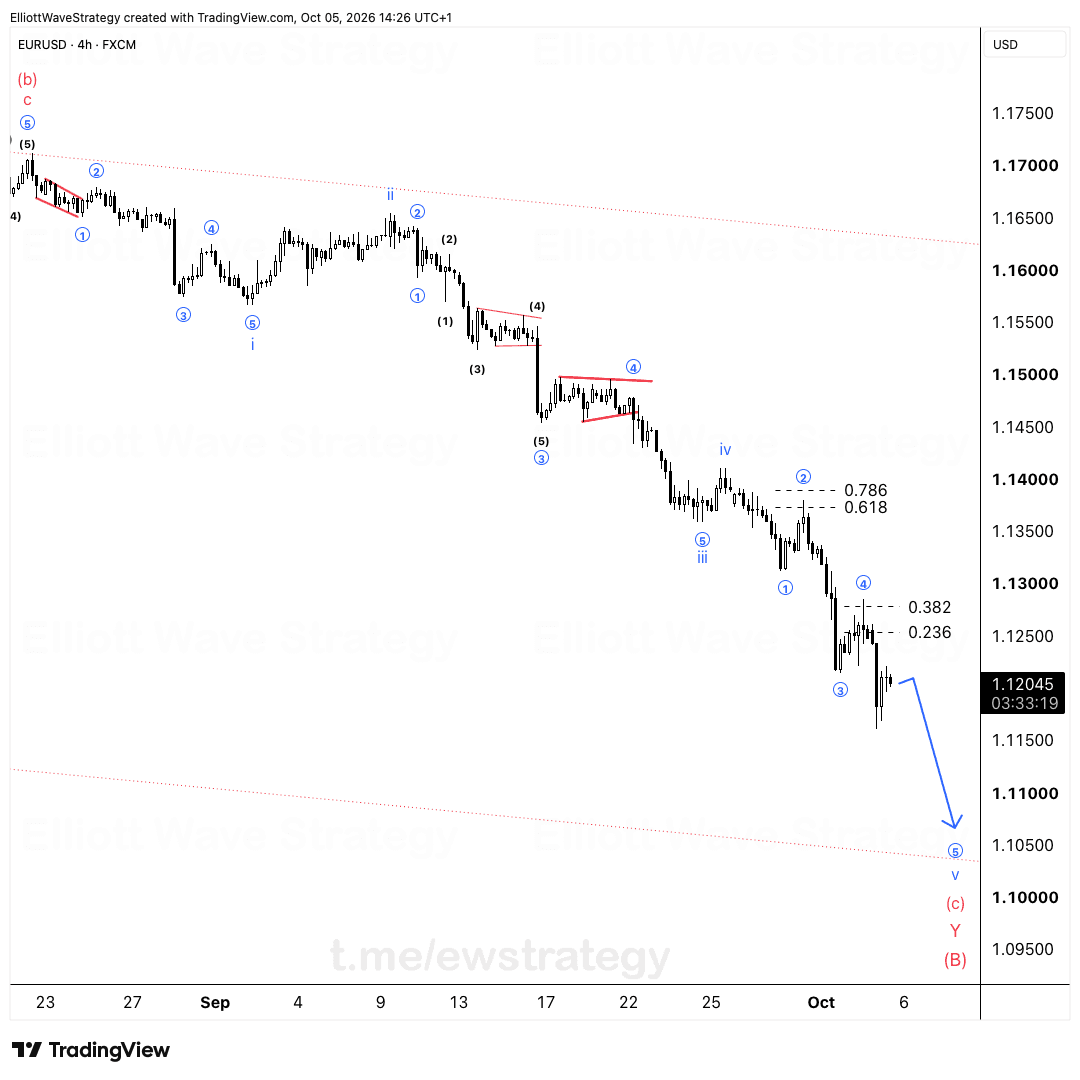
The decline from the 1.17 area was a long grind lower, and the 4-hour chart shows it as a five-wave structure inside wave (c). Wave v of (c) was the last leg, and it ended with price hitting 1.1113 and snapping back.
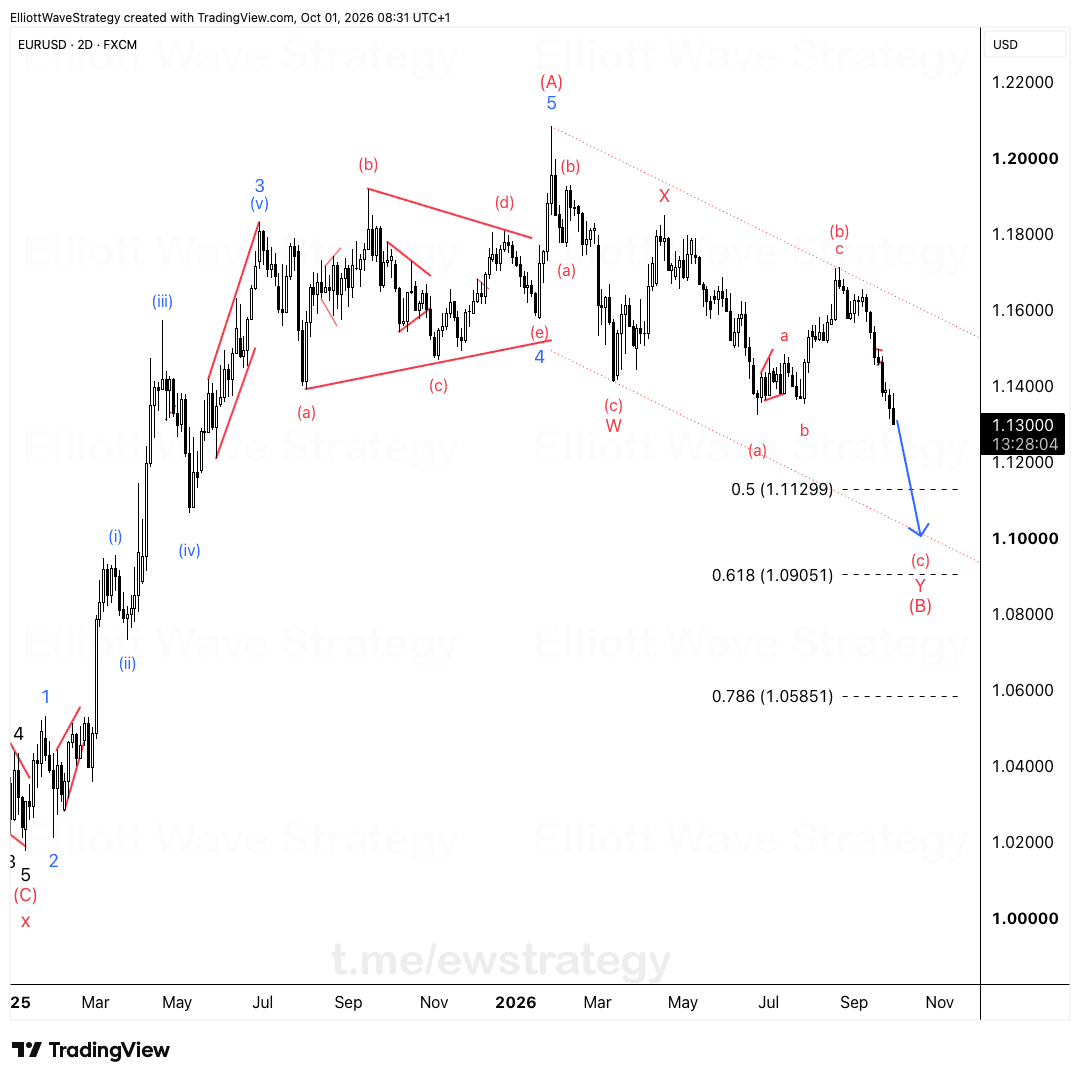
That low closes out wave (c), then wave Y, then wave (B) in one stroke. Three degrees finishing at the same price is what makes this low worth watching.
What did the ending diagonal tell us about EURUSD?
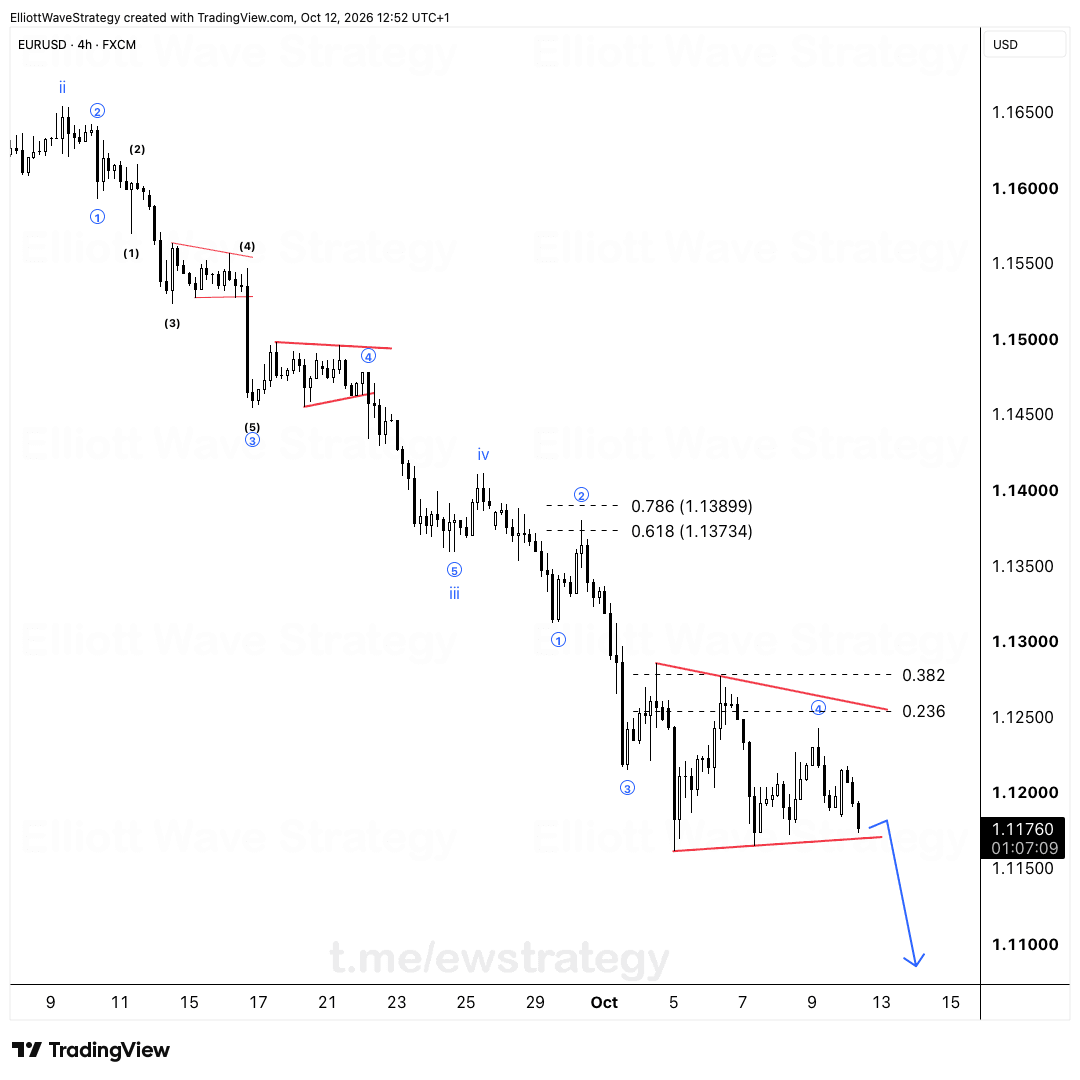
Before the final drop, price compressed into a wedge between the early October highs and the lows near 1.1150. Both boundaries were converging, which is how an ending diagonal looks when a trend is running out of fuel.
The breakout above the upper line is the first sign the pressure has shifted. One breakout is not a trend change, and I treat it as exactly that: a first sign.
What does EURUSD need to do to confirm the low?
I want a pullback that holds above 1.11128. Then I want a push through the bounce high.
That sequence ends this correction. The first pullback after it is where I would look for long setups, because that is where the structure gives you a defined risk point instead of a guess.
Until then, the count stays unconfirmed. Traders who buy the first green candle after a long decline usually find out why confirmation matters.
What invalidates the EURUSD count?
A new low below 1.11128 kills the idea. Simple as that.
If price takes out that level, wave (B) is not done, and the bounce was just a pause inside a larger decline. The invalidation level is a printed price, not a feeling, and that is the whole point of having one.
For how this fits into a larger corrective sequence, see the Elliott Wave forex guide and the full theory guide. Live updates on this pair sit on the EURUSD analysis page.
Key Takeaways
- •EURUSD hit 1.1113 and reversed, which completes wave v of (c) of Y and wave (B) in the Elliott Wave count.
- •The EURUSD bounce has broken out of the ending diagonal, but the low is not confirmed until a pullback holds above 1.11128 and price pushes through the bounce high.
- •A new EURUSD low below 1.11128 invalidates the wave (B) completion idea.
- •The first pullback after a confirmed EURUSD breakout is the area where long setups would be considered, with the invalidation level as the risk reference.
Frequently Asked Questions
What invalidates the bearish EURUSD wave count?
A new low below 1.11128 invalidates the idea that wave (B) completed at 1.1113. If price takes out that level, the bounce was only a pause and the correction is not finished.
How do you confirm a low after an ending diagonal breakout?
Wait for a pullback that holds above the prior low, then a push through the bounce high. A single breakout candle is not enough, because the first move out of a diagonal can fail.
What does wave v of (c) of Y mean on EURUSD?
It is the final leg of a nested corrective structure. Wave v completes wave (c), which completes wave Y, which completes the larger wave (B), all ending at the same low near 1.1113.
Disclaimer: This analysis is for educational purposes only and does not constitute financial advice. Elliott Wave analysis involves subjective interpretation. Always do your own research and manage your risk accordingly.
Get Full Coverage for All 27 Instruments
Premium members receive daily wave counts with entry zones, targets and invalidation levels, published daily across all 27 instruments.
View Premium Plans