GBPJPY Elliott Wave: Last Leg of the W-X-Y Rally
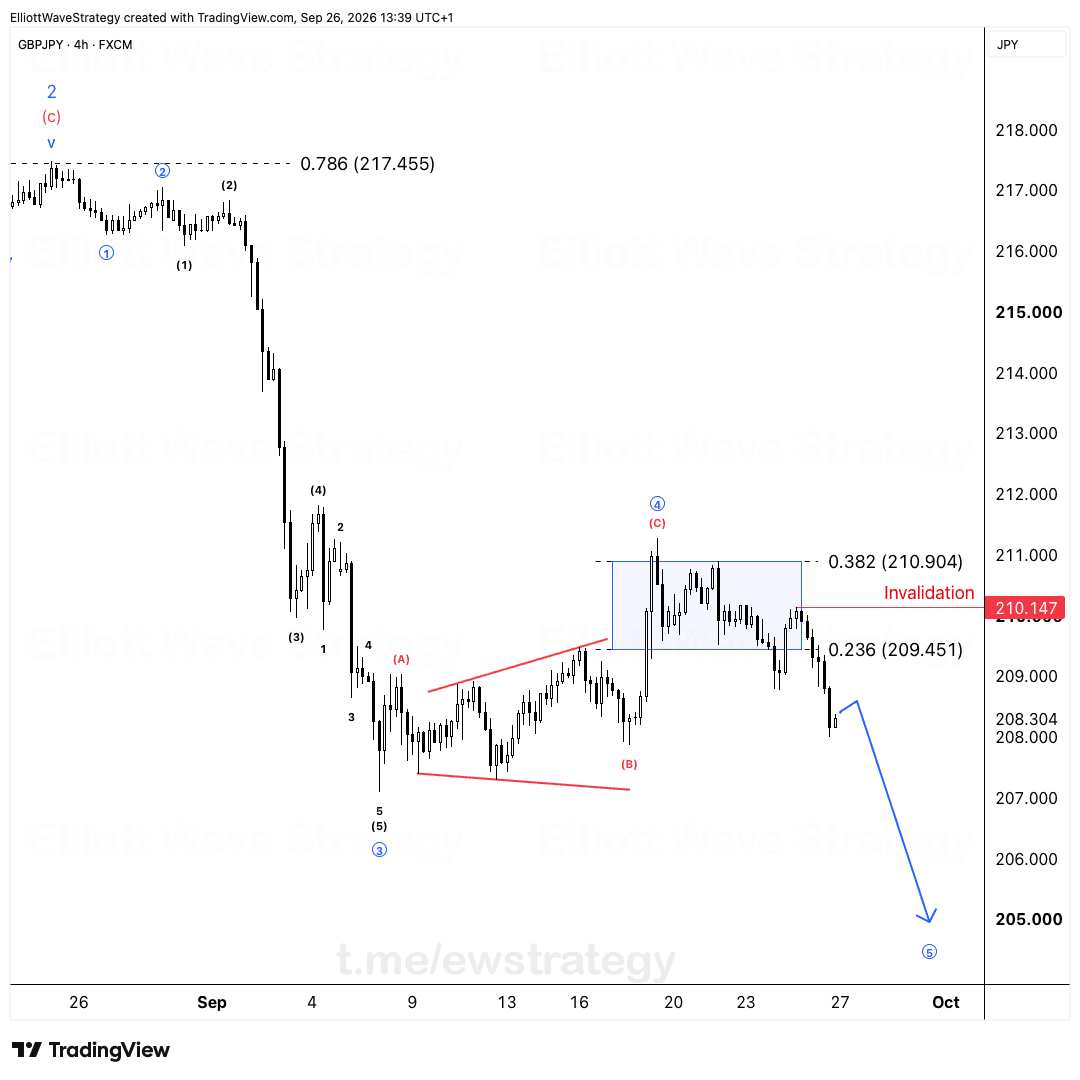
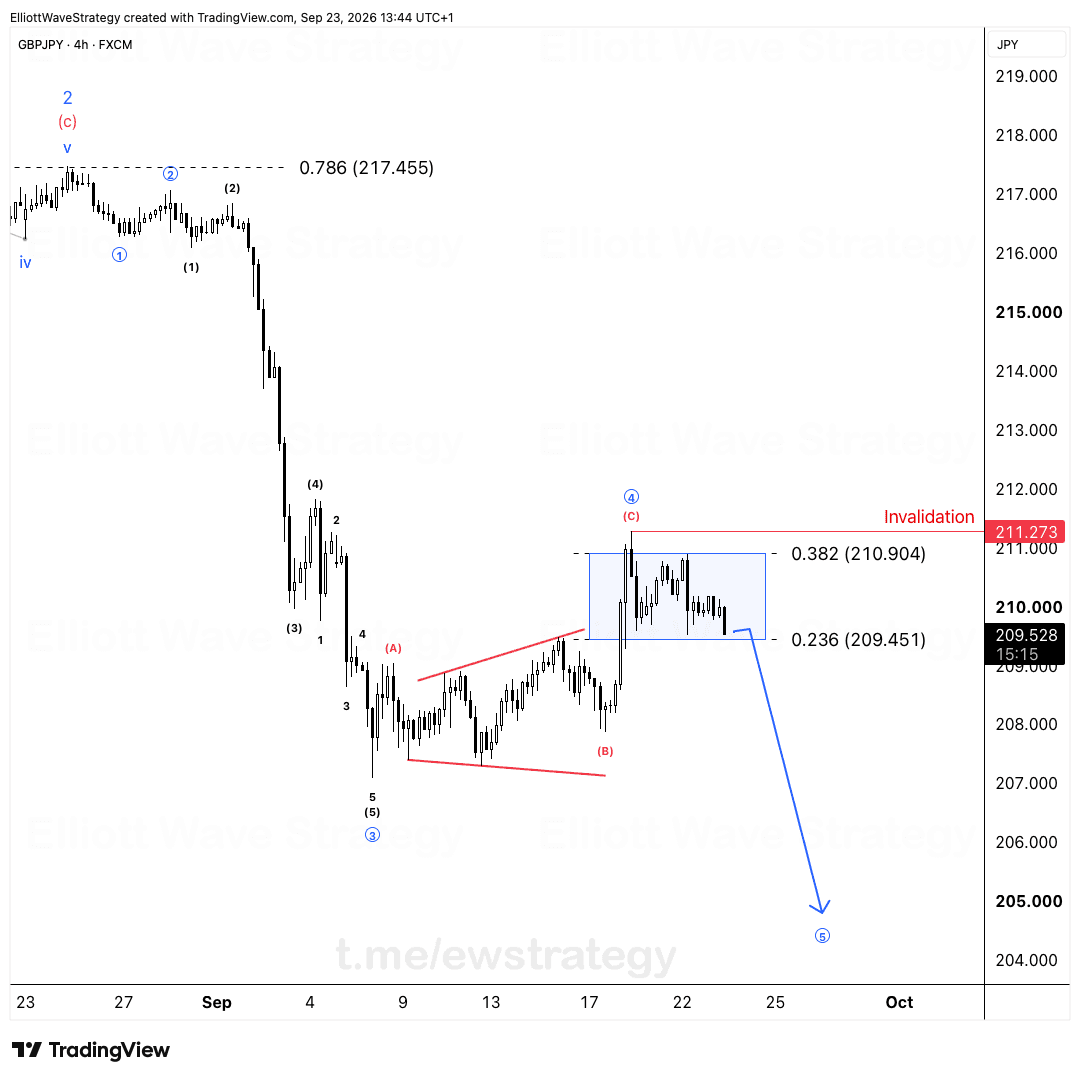
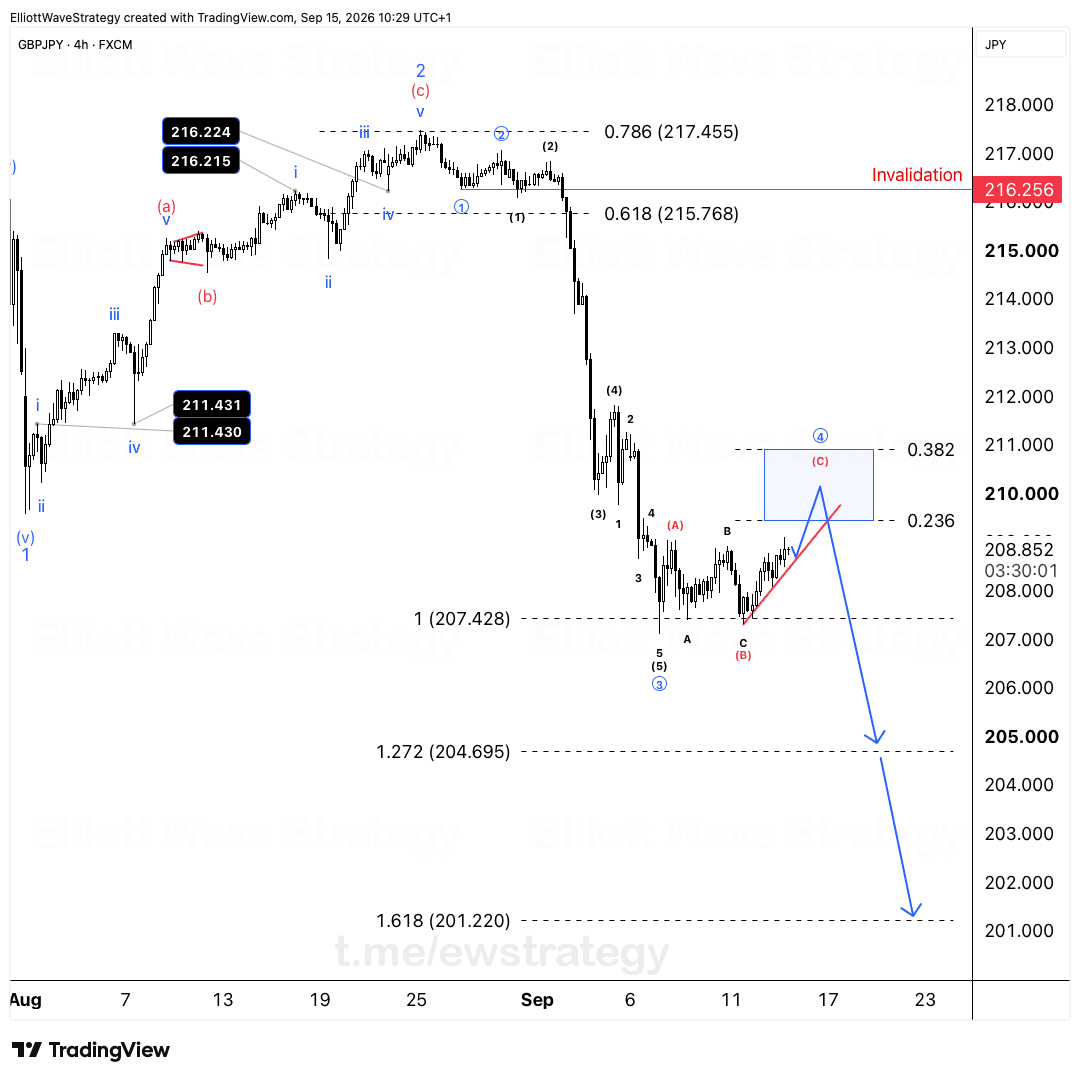
The drop from the August high was five waves. Since the September low it's been correcting in a W-X-Y, and price is in the last leg now, wave (c) of Y.
The drop from the August high on GBPJPY was five waves. Since the September low, price has been correcting in a W-X-Y, and it's in the last leg now: wave (c) of Y.
That's the whole story in two sentences. Everything else is about where the turn is likely to come and what tells me I'm wrong.
Why is the GBPJPY drop from August a five-wave impulse?
The chart shows the decline labeled 1-2-3-4-5, finishing at the September low just above 207.000. That's a complete impulse, and it carries the (c) label at the top of the structure.
An impulse is the trend move. Whatever comes after it is a correction against it, and corrections are where traders get chopped up for weeks. This one is no exception.
What is the W-X-Y correction on GBPJPY?
From the September low, price built a double-three: wave W, then a connecting wave X, then wave Y. Wave W is a clean a-b-c, and the (b) leg inside it carries a clear sideways pattern. Wave X dipped back toward the low area, then wave Y started.
Inside Y, the (a) leg is done, the (b) leg bottomed at 208.354 after probing 208.186 earlier in the structure, and the market is now pushing higher in wave (c). The price at the time of this chart is 211.575, with the 213.000 area sitting just above the upper red line.
Double-threes are slow, annoying, overlapping structures. The market uses them to wear traders out before the original trend resumes.
Where do I expect the GBPJPY turn?
I'll give it a bit more room up into the upper red line, then I expect the turn. That line is the top of the channel I've drawn across the rally from the (b) low, and wave (c) of Y should run out of steam there.
After that, the next leg down heads back toward the September lows. My drawn path runs to roughly 207.000, which is the same zone where wave 5 ended.
I'm not calling the exact top tick. I'm watching an area, and I want to see the reversal show up in price rather than assume it.
What would invalidate this GBPJPY count?
Two things matter here, and they point in opposite directions.
If price drops under 208.19 first, the turn has already started. That level is the low from the earlier pullback inside the structure, and a break below it means the rally is over.
If the rise runs well past the red line instead, the correction is bigger than this count allows. In that case I rework the count. I won't defend a wave label against the market.
That's how I treat every count: it's a map with a stated way to be wrong, not a belief.
Key Takeaways
- •GBPJPY fell from the August high in five waves, which makes the September low the end of the impulse leg.
- •Since the September low, GBPJPY has corrected in a W-X-Y double-three and is now in wave (c) of Y.
- •The GBPJPY turn is expected near the upper red channel line, with the next leg down heading back toward the September lows.
- •A drop under 208.19 on GBPJPY means the turn has already started.
- •If GBPJPY rises well past the upper red line, the correction is larger than this count and the wave count gets reworked.
Frequently Asked Questions
What is the current Elliott Wave count on GBPJPY?
GBPJPY completed a five-wave decline from the August high, then began a W-X-Y correction from the September low. Price is in the final leg, wave (c) of Y, rising toward the upper red channel line.
What invalidates the bearish GBPJPY count?
If the rise runs well past the upper red line, the correction is larger than the W-X-Y count allows, and the count has to be reworked. A drop under 208.19 first would instead confirm the turn has already started.
Where is GBPJPY expected to go after wave (c) of Y ends?
After the turn, the next leg down heads back toward the September lows, near 207.000. That is the zone where the five-wave decline ended.
Disclaimer: This analysis is for educational purposes only and does not constitute financial advice. Elliott Wave analysis involves subjective interpretation. Always do your own research and manage your risk accordingly.
Get Full Coverage for All 27 Instruments
Premium members receive daily wave counts with entry zones, targets and invalidation levels, published daily across all 27 instruments.
View Premium Plans