US100 Elliott Wave: Wave 3 Cleared, 31,400 Next
We've followed this move from the start. Price pulled back into our marked area, broke the trendline, and wave (4) held between the 0.236 and 0.382 zone. The pr
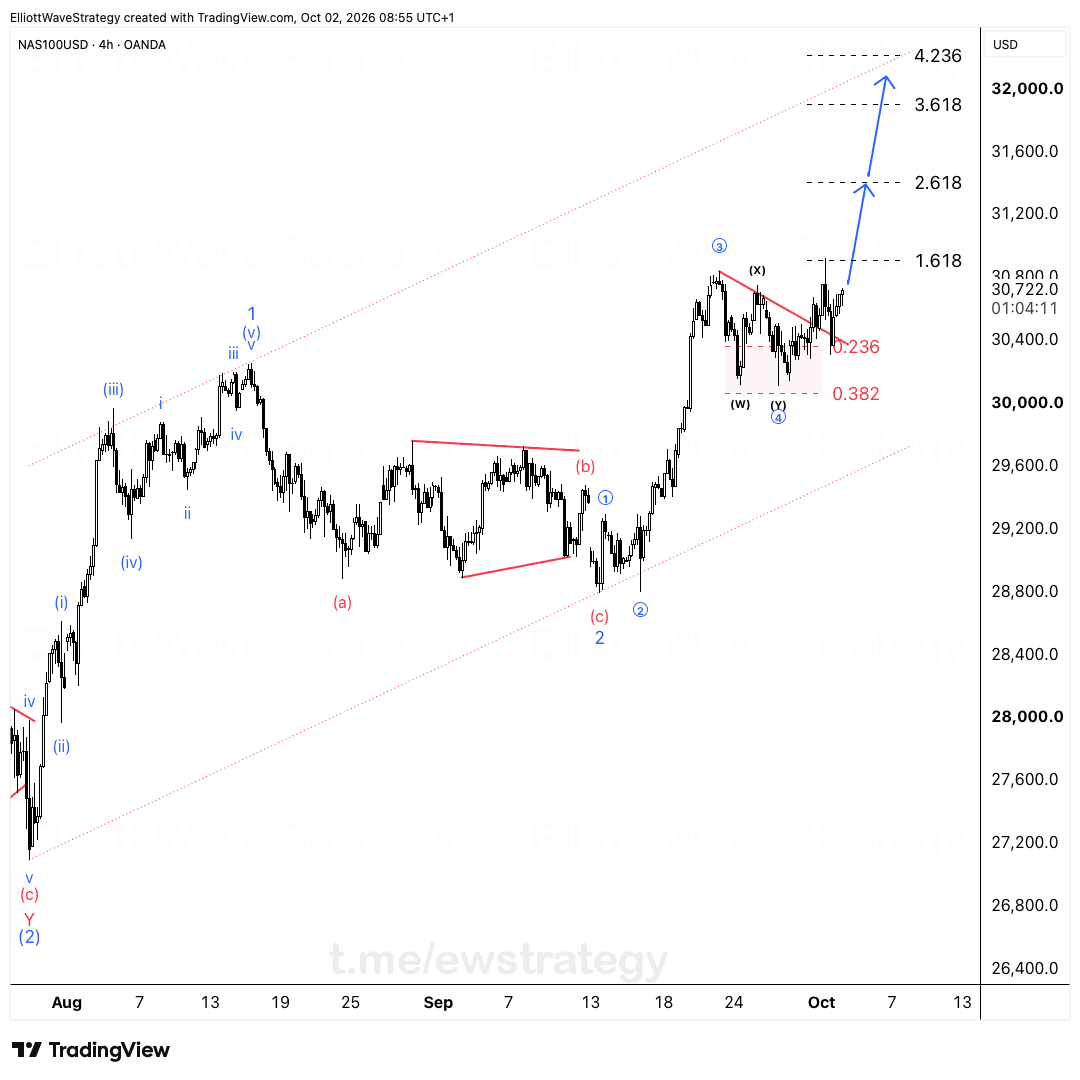
We've followed this move from the start. Price pulled back into our marked area, broke the trendline, and wave (4) held between the 0.236 and 0.382 zone. The previous high was still ahead of us then.
Now it's behind us. Wave (3) is cleared and Nasdaq is heading for 31,400, the 2.618 extension on the chart.
Where does the US100 Elliott Wave count stand now?
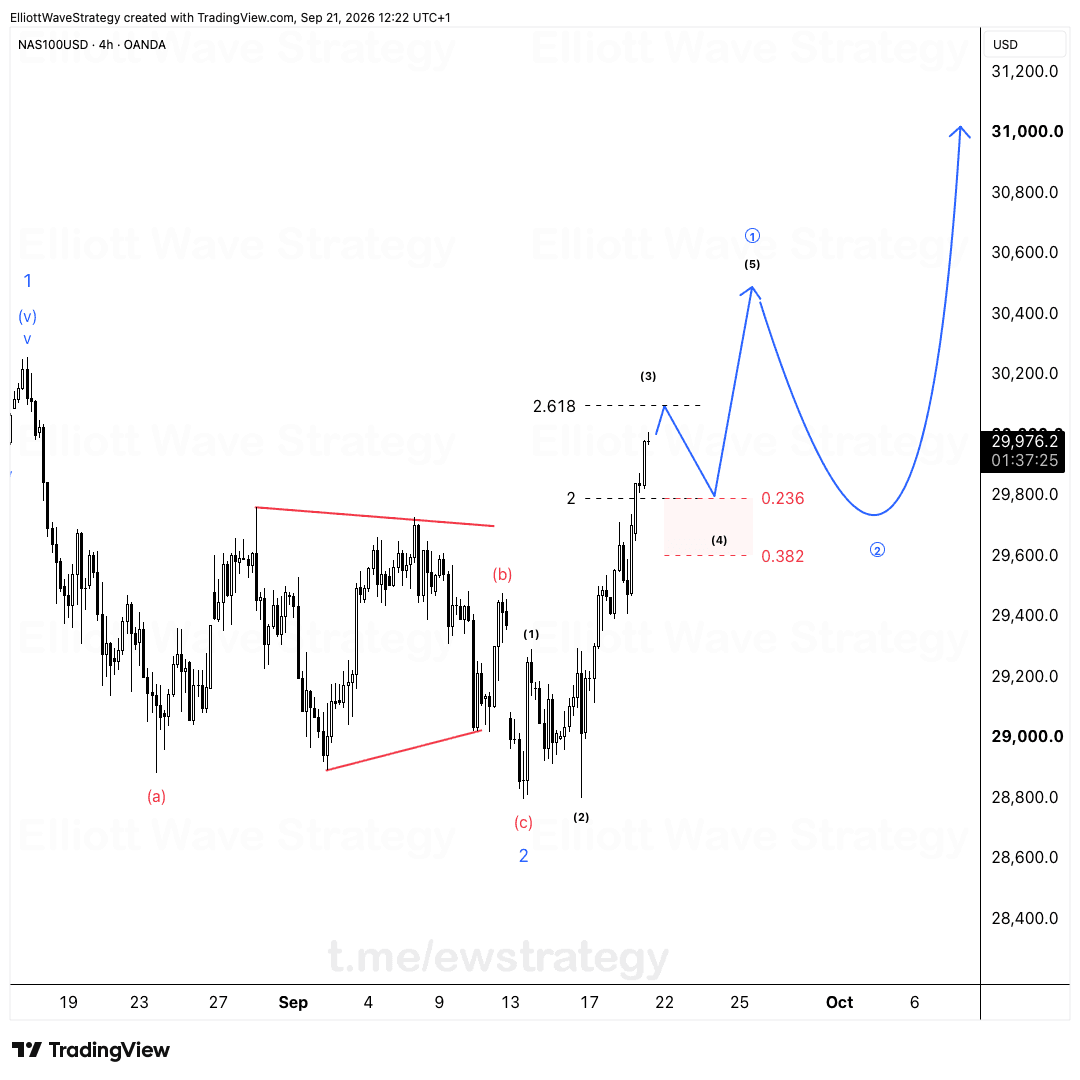
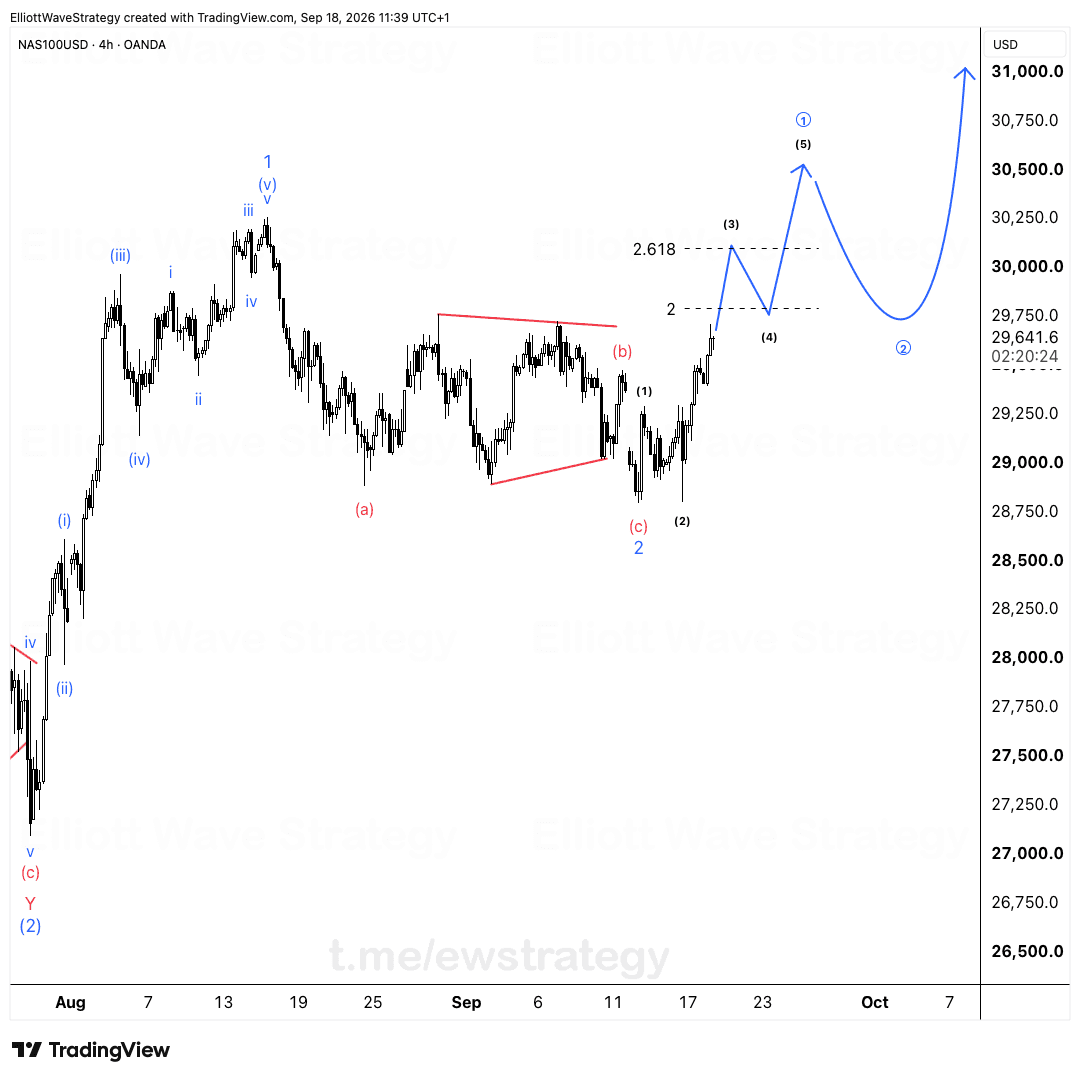
The 4-hour chart shows a clean sequence. Wave 1 topped out in mid-August, and wave 2 corrected through a flat-type structure with an (a)-(b)-(c) leg before the low held near the lower channel line. From there, the circled sub-waves took over: circled 1, circled 2, and then the push into circled 3.
Circled 3 peaked just below 30,900. Price has since moved above that high, which confirms the third wave is complete and the market is now working through the next stretch of the same advance. This is how a healthy impulse behaves: the pullback stays shallow and the old high gets taken out.
How did wave (4) hold the 0.236 to 0.382 zone?
Wave (4) built a (W)-(X)-(Y) double correction. It stayed inside the shaded area between the 0.236 and 0.382 retracement levels, which is shallow for a fourth wave. Shallow corrections after a strong third wave tell you buyers were not giving ground.
Price then broke the descending trendline drawn across the (X) high. That break is what turned a correction into a resumption. Traders who waited for a deep retrace to 0.5 or 0.618 got left behind. The market simply did not offer it.
What is the US100 target after wave 3?
The nearest objective is 31,400, the 2.618 extension marked on the chart. Price is trading around 31,160 as I write this, so that level sits close.
Beyond it, I think there's room for 32,000 near the upper channel before this leg finishes. The 3.618 and 4.236 extensions sit in that same area, so the upper channel and the Fibonacci projections point to one zone rather than scattered levels. Confluence like that is what makes a target worth marking.
What comes after the 32,000 area?
After that I expect a bigger correction. My broader view is still up, so that pullback is where I'll be looking for the next entry.
This matters for how you read the whole chart. A top near the upper channel does not end the larger uptrend. It ends one leg inside it. Confusing a correction with a reversal is the most expensive mistake traders make on indices, because they sell the pullback and then watch the next advance leave without them.
For more on how indices behave in impulse structures, see the Elliott Wave stocks and indices guide.
Key Takeaways
- •US100 wave (4) held between the 0.236 and 0.382 retracement zone, a shallow correction that signaled strength before the breakout.
- •Wave (3) on the Nasdaq 100 is cleared, and the next Elliott Wave target is 31,400, the 2.618 extension.
- •US100 has room toward 32,000 near the upper channel, where the 3.618 and 4.236 extensions also cluster.
- •A larger correction is expected after the US100 reaches the 32,000 area, but the broader trend remains up.
- •The break of the trendline over the (X) high turned the US100 correction into a continuation.
Frequently Asked Questions
What is the next US100 target in the Elliott Wave count?
The nearest target is 31,400, the 2.618 extension marked on the chart. Beyond that, 32,000 near the upper channel is the larger objective for this leg.
Why did wave (4) on US100 stop at the 0.236 to 0.382 zone?
Shallow fourth waves often follow a strong third wave, because buyers defend the move early. Wave (4) here formed a (W)-(X)-(Y) correction and held inside that zone before the trendline broke.
What happens on the US100 after 32,000?
I expect a bigger correction after this leg finishes, while the broader view stays up. That pullback is where the next entry area would come from.
Disclaimer: This analysis is for educational purposes only and does not constitute financial advice. Elliott Wave analysis involves subjective interpretation. Always do your own research and manage your risk accordingly.
Get Full Coverage for All 27 Instruments
Premium members receive daily wave counts with entry zones, targets and invalidation levels, published daily across all 27 instruments.
View Premium Plans