US100 Elliott Wave: Wave 4 Done, Targets 31,400 and 32,000
The correction took longer than I expected after our last update, but Nasdaq has now broken above the falling trendline. I think wave ④ is done.
The correction took longer than I expected after our last update, but Nasdaq has now broken above the falling trendline. I think wave ④ is done.
That is the read on US100 right now. Here is how the structure got there and what I want to see next.
Is the US100 wave 4 correction finished?
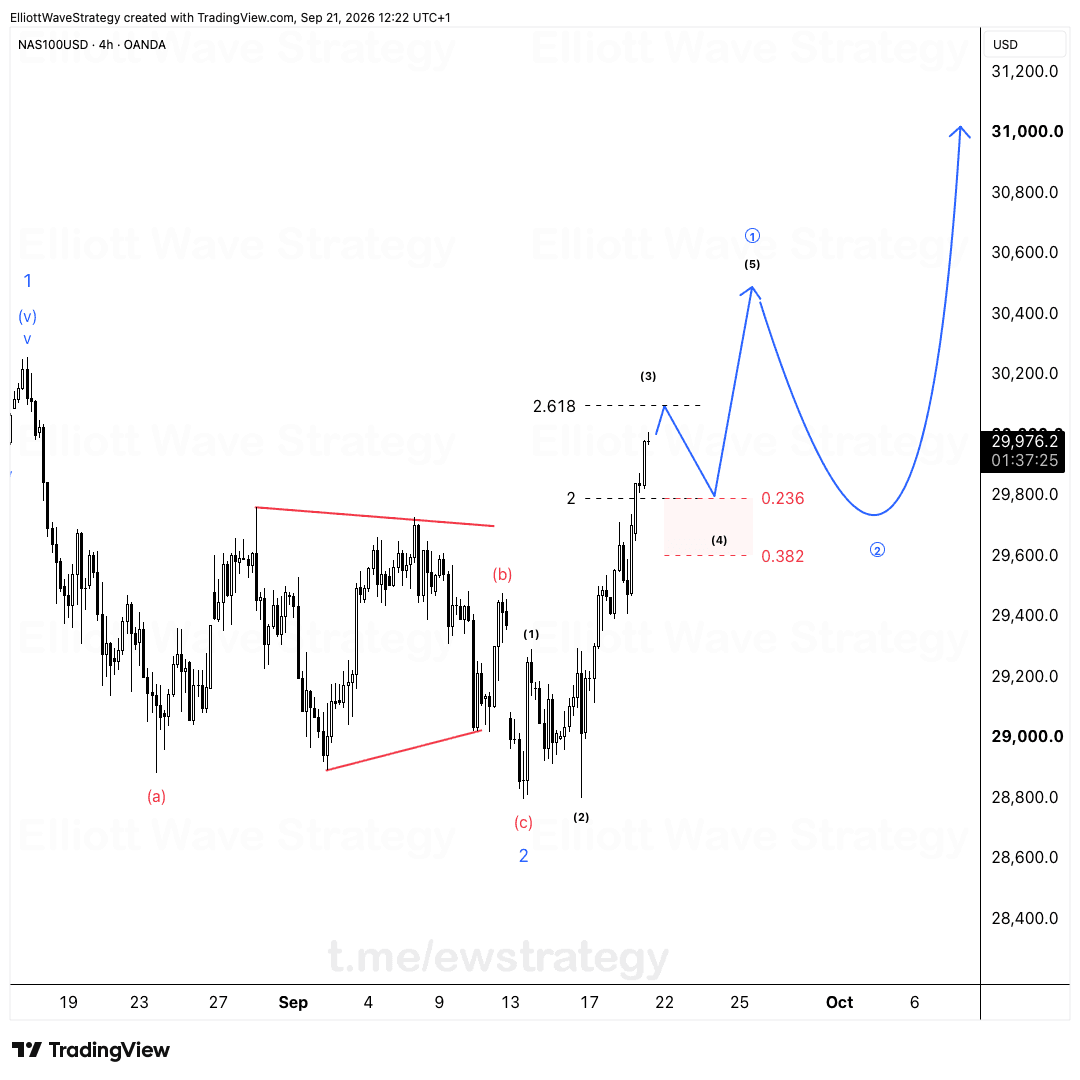
I think so. Wave ④ played out as a WXY, a sideways, overlapping structure that stayed contained the whole time. Wave (W) made the low, (X) bounced, and (Y) retested the zone without breaking it.
The trendline break is the first sign it's over. It is not the final confirmation, and I am not treating it as one.
Where did the US100 correction stop?
It held between the 0.236 and 0.382 retracements of wave ③. That is a shallow pullback for a fourth wave. Shallow corrections after a strong third wave usually mean buyers never lost control.
The zone around 30,000 contained everything. As long as that area holds, the WXY reads as a pause inside the larger advance and not as a trend change. Traders who expected a deeper drop had to sit through a lot of sideways chop for nothing.
What does the bigger Elliott Wave structure show?
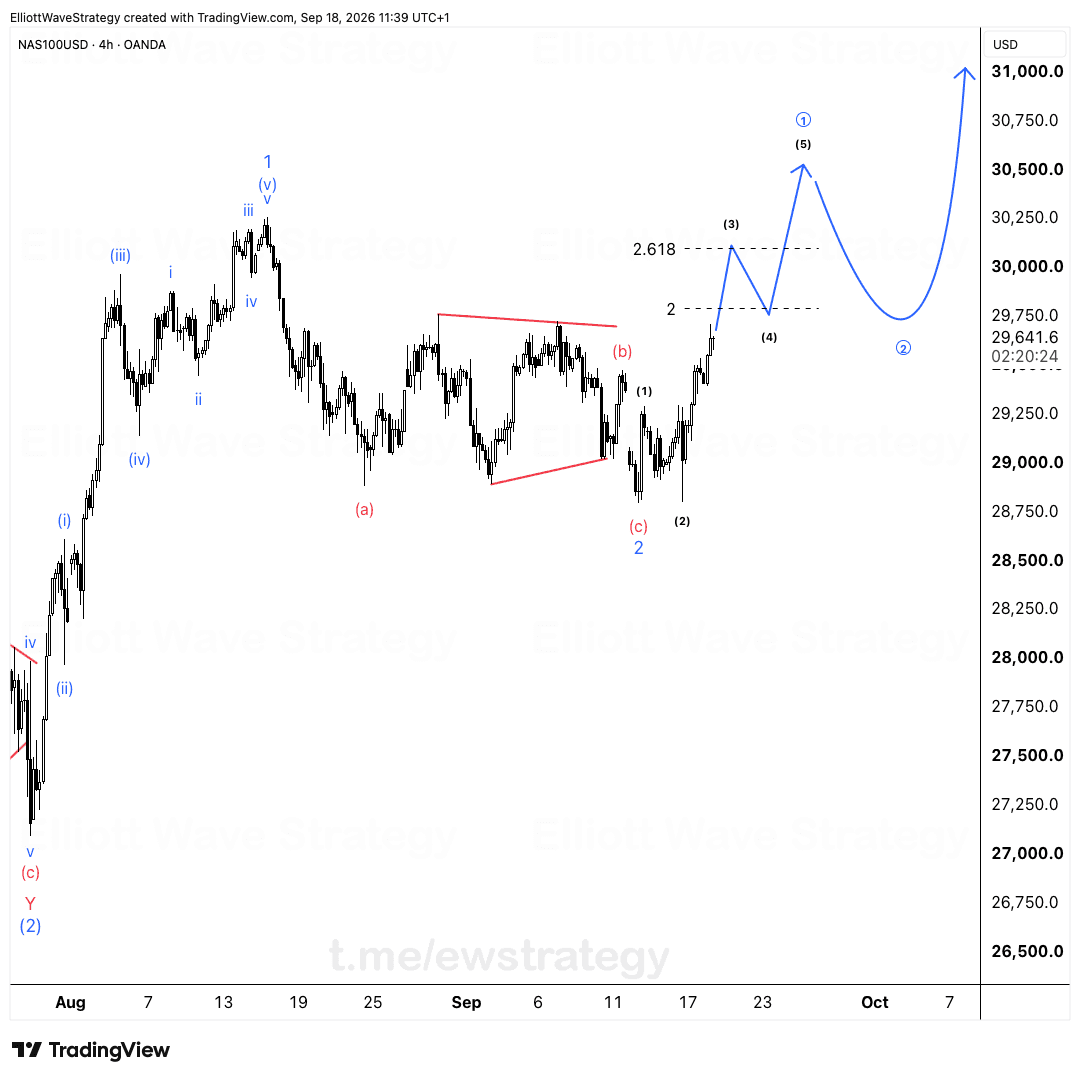
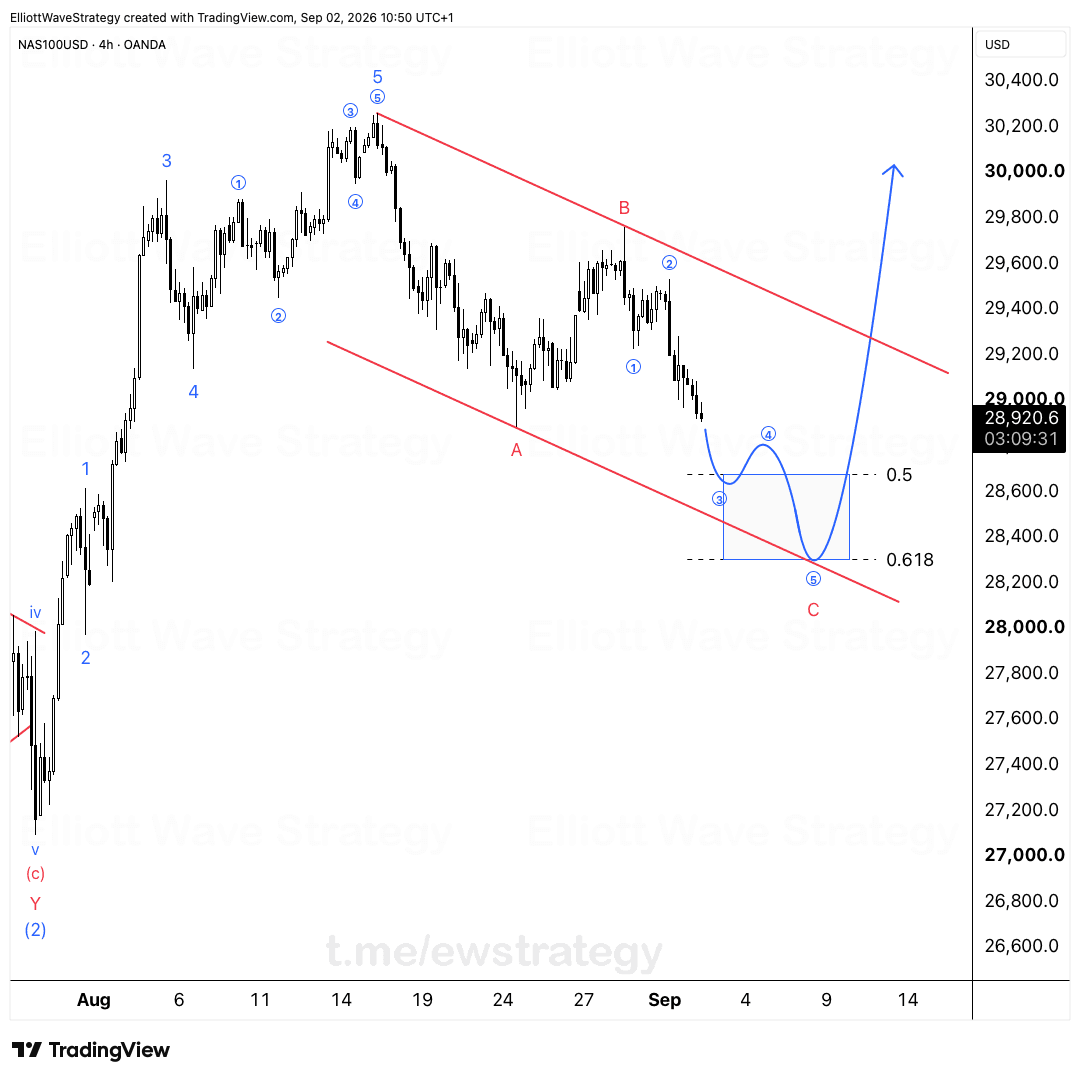
Zoom out and the picture is clean. Wave (2) bottomed in late July near 27,000, then price built wave 1 up to the August high. Wave 2 came as a flat-style correction into mid September, with the (a)-(b)-(c) legs visible and a contracting triangle inside wave (b).
From the wave 2 low, circled ① and ② are done, circled ③ ran to roughly 30,800, and now circled ④ sits complete in my count. That leaves circled ⑤ as the next leg. The whole move has respected the rising channel, with the lower line supporting wave 2 almost to the tick.
What are the US100 targets for wave 5?
First I want to see price clear the previous high near 30,800. Until that happens, the count is a thesis and not a confirmed breakout.
After that I'm looking at 31,400, the 2.618 extension, with room for 32,000 near the upper channel line. The Fibonacci extension levels above that, 3.618 and 4.236, mark where an extended fifth could stretch, but 31,400 and 32,000 are the zones I care about first.
No level on this chart is a trade instruction. It is a map of where the count says price should react.
What would change this count?
A sustained move back inside the 0.236 to 0.382 zone would put the trendline break in doubt. A drop below the 0.382 area around 30,000 would mean the WXY was not the full fourth wave, and I would have to rework the structure.
Until then, the break is the first real evidence that the correction is over.
Key Takeaways
- •US100 completed a WXY wave 4 correction that held between the 0.236 and 0.382 retracements of wave 3.
- •The break above the falling trendline is the first sign the US100 correction is over, but price must still clear the 30,800 high.
- •The next US100 Elliott Wave targets are 31,400, the 2.618 extension, and 32,000 near the upper channel line.
- •A shallow wave 4 in US100 suggests buyers kept control through the entire correction.
- •A move back below the 30,000 area would challenge the completed wave 4 count on US100.
Frequently Asked Questions
Is US100 wave 4 over according to Elliott Wave?
In my count, yes. The WXY correction held between the 0.236 and 0.382 retracements and price has broken the falling trendline. I still want to see a clear break of the previous high near 30,800 for full confirmation.
What are the Elliott Wave targets for US100?
The first target is 31,400, the 2.618 extension of the move. Beyond that, 32,000 near the upper channel line is the next zone, with the 3.618 and 4.236 extensions sitting higher still.
What invalidates the bullish US100 count?
A sustained drop back into the 0.236 to 0.382 zone would weaken it, and a break below the 0.382 area near 30,000 would mean wave 4 was not finished. In that case the structure needs to be reworked.
Disclaimer: This analysis is for educational purposes only and does not constitute financial advice. Elliott Wave analysis involves subjective interpretation. Always do your own research and manage your risk accordingly.
Get Full Coverage for All 27 Instruments
Premium members receive daily wave counts with entry zones, targets and invalidation levels, published daily across all 27 instruments.
View Premium Plans