US100 Elliott Wave: Wave IV Done, Wave V Next?
I think the Nasdaq's long correction is over. On the daily, wave III topped in June at 30,773. Wave IV then ground on for five months as a double correction, (W
I think the Nasdaq's long correction is over. Five months of grinding lower, and the structure says it finished on 6 November at 26,273.
That's a big claim, so here is the count and what proves it wrong.
Where did the US100 correction end?
On the daily chart, wave III topped in June at 30,773. Wave IV then ground on for five months as a double correction: (W), (X) and (Y).
The (Y) leg finished at the 6 November low of 26,273. That low is labeled wave IV on the chart, with the final C-wave of (Y) ending in five sub-waves down to it.
Traders hate long corrections. Most of them gave up on the Nasdaq somewhere in the middle of this one, which is typical for the late stage of a wave IV.
What does the 4h bounce from 26,273 tell us?
The bounce off that low came in five waves. A five-wave move off a major low is an impulse wave, and that matters. A corrective rally would come in three.
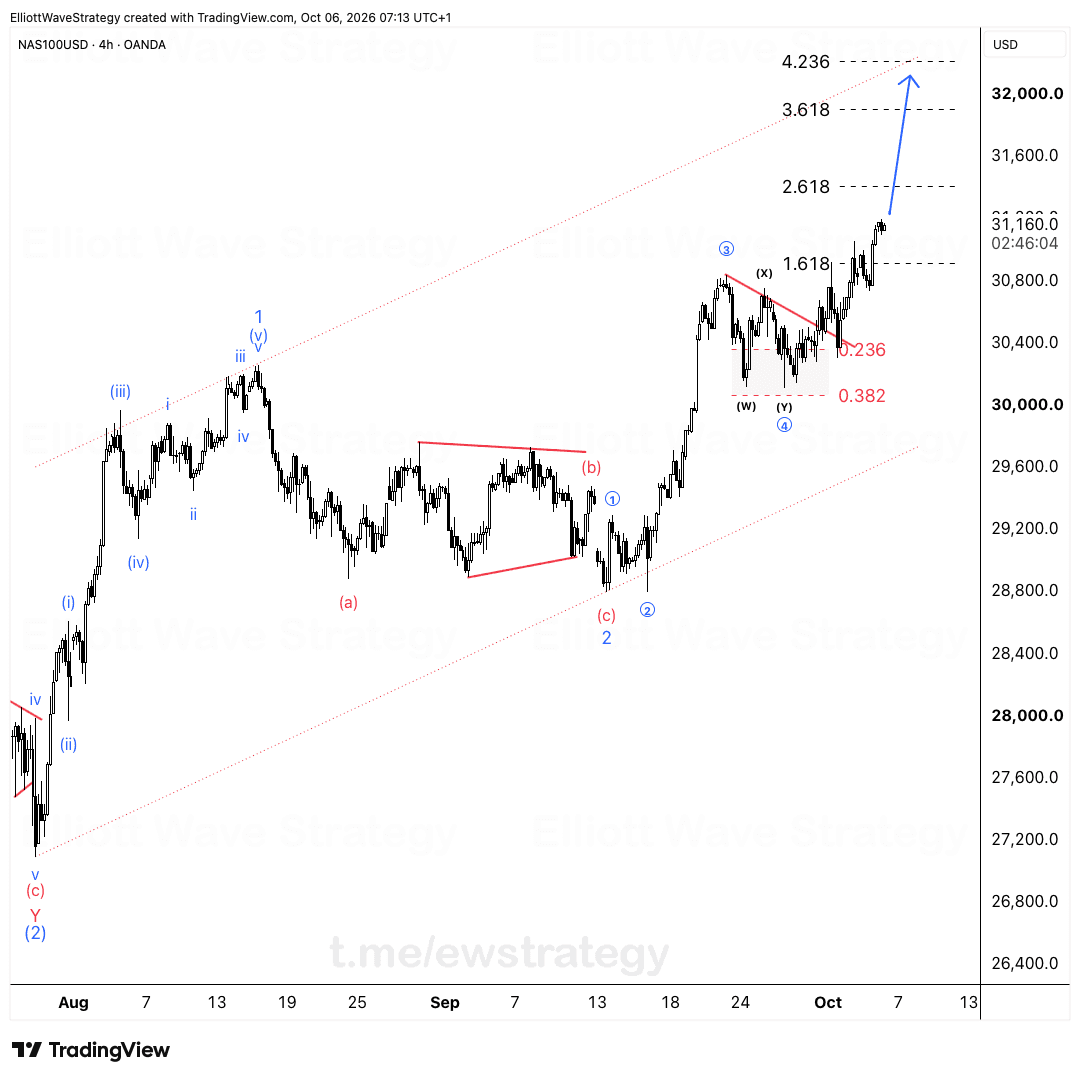
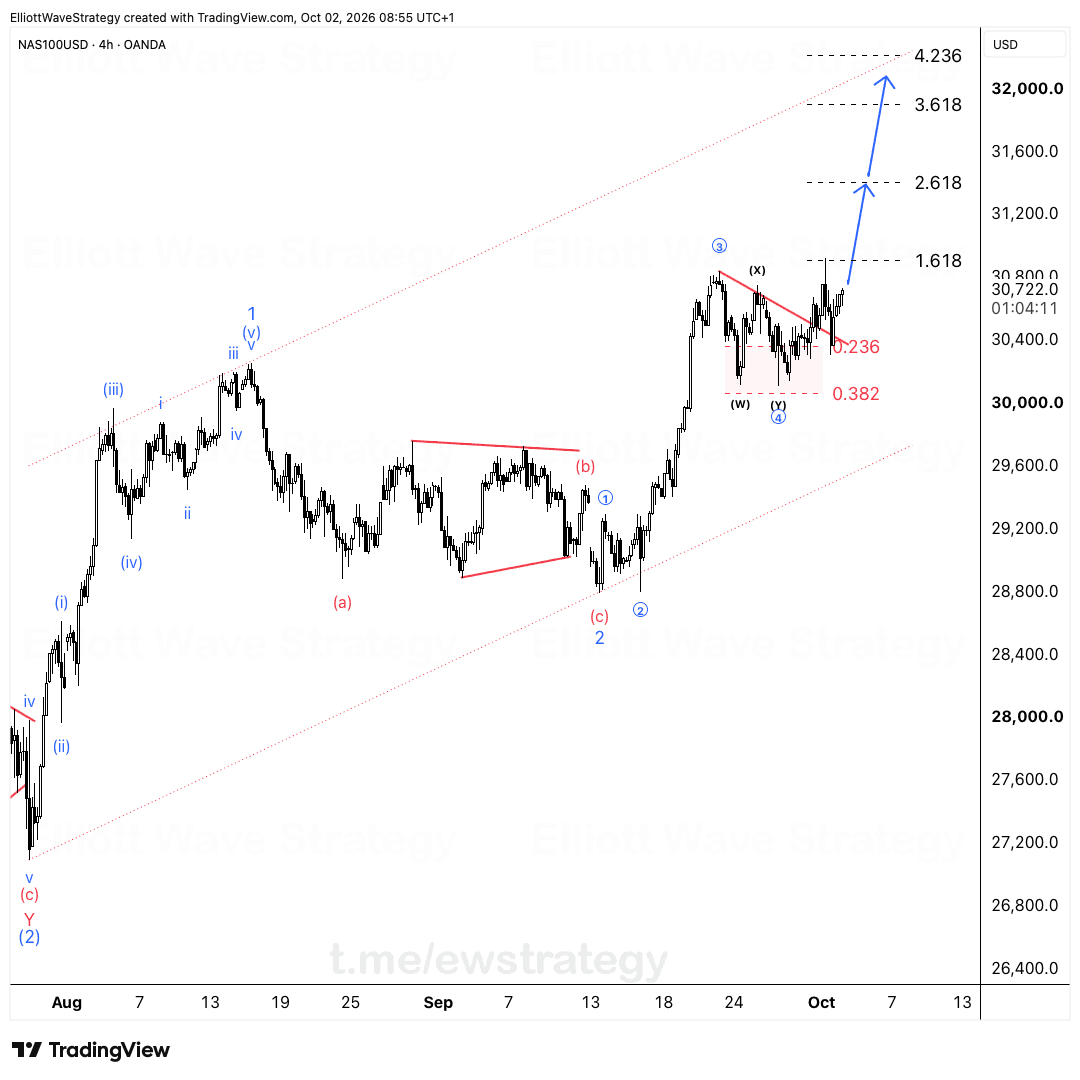
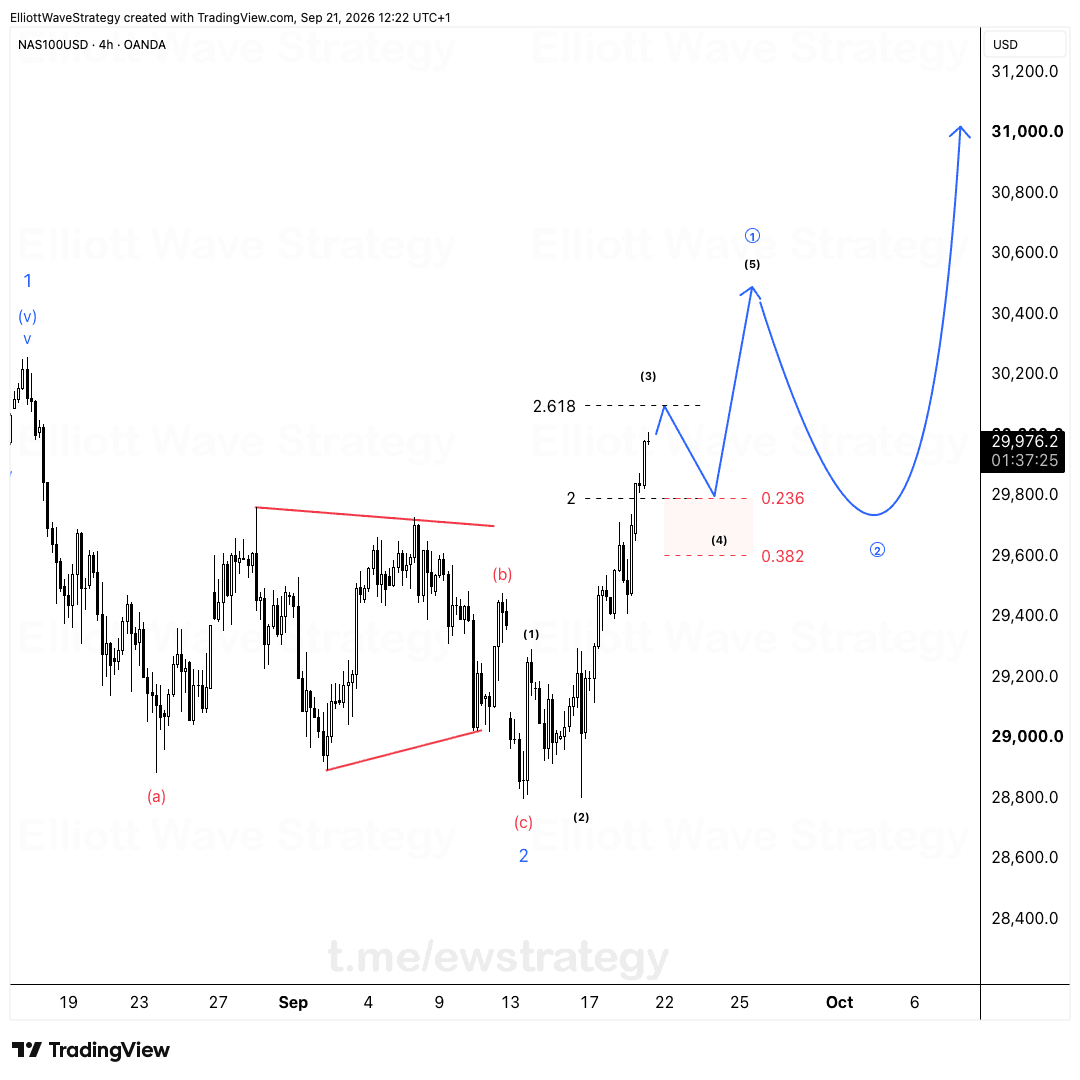
I count it as wave i of the next leg. The circled 1 through 5 inside it are clean: wave 3 extends, wave 4 stays shallow, wave 5 tops out near 28,800 before sellers step in.
That is the structure you want to see if a new trend is starting.
Where does the wave ii pullback end?
The current dip is wave ii. I expect it to pull back into the 0.5 to 0.618 zone, between 27,450 and 27,173.
Those are standard Fibonacci retracement levels for a second wave. Price is trading near 27,590 as I write, so the zone is right below.
Wave ii is where impatient traders get shaken out. The move down feels like the rally failed. It didn't. It's a normal retrace inside a larger impulse.
What happens if wave iii starts from here?
If price holds above 26,273, I expect wave iii to start from this zone. Wave iii is usually the strongest part of any impulse.
On the daily, this is wave V. The target is new highs above the October top at 31,400. The blue arrow on my chart shows the trajectory, with the path ending near 30,500 on the 4h scale for the first leg.
The count is simple to judge because the invalidation level is a hard number.
What invalidates the count?
Below 26,273, the count is wrong. No debate, no reinterpretation after the fact.
That is the only reason to put a view like this on the table. A wave count without an invalidation point is an opinion you can never lose, and those are worthless.
For the full theory behind impulse and corrective structures, read the Elliott Wave theory guide. For how I apply it to indices, see Elliott Wave for stocks and indices.
Key Takeaways
- •US100 completed a five-month double correction, (W), (X), (Y), at the 6 November low of 26,273 according to this Elliott Wave count.
- •The bounce from 26,273 on the US100 4h chart came in five waves, which supports reading it as wave i of a new impulse.
- •The US100 wave ii pullback targets the 0.5 to 0.618 retracement zone between 27,450 and 27,173.
- •A hold above 26,273 keeps the US100 wave V scenario alive, with new highs above the October top at 31,400 as the objective.
- •A break below 26,273 invalidates the bullish US100 count completely.
Frequently Asked Questions
What invalidates the bullish US100 Elliott Wave count?
A move below 26,273, the 6 November low. If price trades beneath it, wave IV is not complete and the bullish count is wrong.
Where is the US100 wave ii pullback expected to end?
Between 27,450 and 27,173, the 0.5 to 0.618 Fibonacci retracement zone of wave i. A hold above 26,273 keeps the structure intact.
What is the US100 target if wave V plays out?
New highs above the October top at 31,400. The daily wave III topped in June at 30,773, so wave V pushing past 31,400 would make a new all-time high.
Disclaimer: This analysis is for educational purposes only and does not constitute financial advice. Elliott Wave analysis involves subjective interpretation. Always do your own research and manage your risk accordingly.
Get Full Coverage for All 27 Instruments
Premium members receive daily wave counts with entry zones, targets and invalidation levels, published daily across all 27 instruments.
View Premium Plans