USDCAD Elliott Wave: Fib Zone Hit, No Reversal Yet
USDCAD 🇺🇸🇨🇦 - (https://s3.tradingview.com/snapshots/o/oZmvtvFR.png)
Catching the exact top feels good. But you don't need the first candle to take part in a move.
USDCAD just hit the 0.618-0.786 retracement zone on wave ii of c. That gets attention. It doesn't confirm a reversal on its own, and treating a Fib tap as a trade trigger is how traders lose money waiting for confirmation that never showed up.
What does the USDCAD chart actually show right now
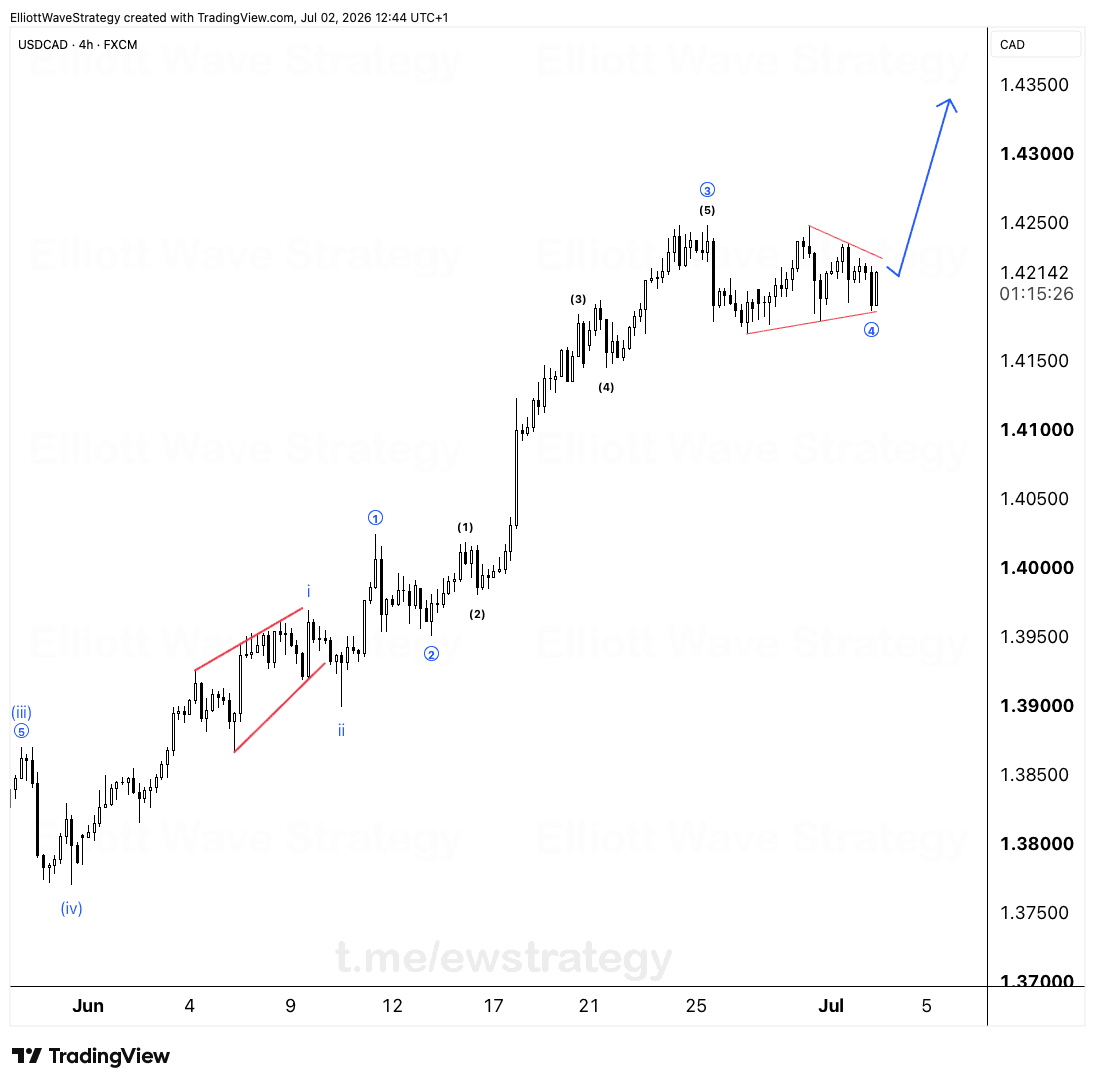
The move up from the wave b low near 1.37500 is labeled as a corrective advance into wave a, then a pullback into wave b, now pushing into wave c. That c wave is landing right inside the 0.618 to 0.786 retracement band of the prior decline, between roughly 1.39821 and 1.40500.
This zone lines up with where a wave ii top would typically form before the next leg down. It's a location where reversals happen. It is not proof that one is happening.
Why hitting a Fibonacci zone isn't a sell signal
Price tapping a retracement level tells you where a turn is statistically more likely. It says nothing about timing or confirmation.
The bearish count on USDCAD stays valid as long as price holds below 1.41290. That's the invalidation line drawn on the chart. Above it, the entire corrective structure from wave (ii) forward is wrong, and the whole bearish read gets scrapped.
Below that line, the picture supports a larger decline unfolding in five waves down, projected toward the 1.37000 region based on the drawn trajectory. But a projection isn't an entry.
What actually needs to happen before any entry gets planned
We're not selling into strength just because a Fib zone got tapped. The sequence that matters is a clear move down first, confirming the reversal is real, then a pullback into that move to structure an actual entry.
Entry, stop, position size, in that order. That's the whole job. Everything before that is just information gathering.
Waiting here isn't doing nothing. It's collecting the data the market hasn't handed over yet: whether sellers actually show up at this zone, and whether the structure below starts printing lower highs and lower lows the way a real wave iii would.
The bottom line for USDCAD from here
The setup is interesting, not actionable. 1.41290 is the line that decides whether this bearish count survives or gets thrown out entirely. Until price breaks down and gives a pullback to work with, this is a chart to watch, not a chart to trade.
Save this chart. We'll track the next steps as they come.
Key Takeaways
- •USDCAD hit the 0.618-0.786 Fibonacci retracement zone on wave ii of c, a location where reversals often start but never a confirmation on its own.
- •The bearish Elliott Wave count on USDCAD stays valid only below 1.41290; a break above that invalidation level scraps the corrective read entirely.
- •The projected bearish path for USDCAD points toward the 1.37000 area, but that target only matters if a confirmed move down happens first.
- •Traders should wait for a clear decline followed by a pullback before structuring any entry, stop, and position size on USDCAD.
- •Waiting for confirmation on USDCAD isn't passive, it's the process of gathering the information the market hasn't given yet.
Frequently Asked Questions
What invalidates the bearish USDCAD Elliott Wave count?
A close above 1.41290 invalidates the bearish corrective count on USDCAD. Above that level the wave (ii) structure and everything built on it no longer holds.
Does tapping the 0.618-0.786 Fibonacci zone mean USDCAD will reverse?
No. It means price reached a zone where reversals commonly occur, but confirmation requires an actual break lower in price structure, not just a Fibonacci tag.
What is the bearish target for USDCAD if the count plays out?
The drawn projection points toward the 1.37000 region, based on the trajectory in the chart, contingent on price staying below the 1.41290 invalidation level.
Disclaimer: This analysis is for educational purposes only and does not constitute financial advice. Elliott Wave analysis involves subjective interpretation. Always do your own research and manage your risk accordingly.
Get Full Coverage for All 27 Instruments
Premium members receive daily wave counts with entry zones, targets and invalidation levels, published daily across all 27 instruments.
View Premium Plans