US100: Wave 2 Done, Five-Wave Rally Toward 30,500
US100 🇺🇸 - (https://s3.tradingview.com/snapshots/k/K4EkutZC.png)
Nasdaq is pushing higher again. Wave 2 correction into the (c) leg looks complete on the 4h chart, and the structure now points to a fresh five wave advance.
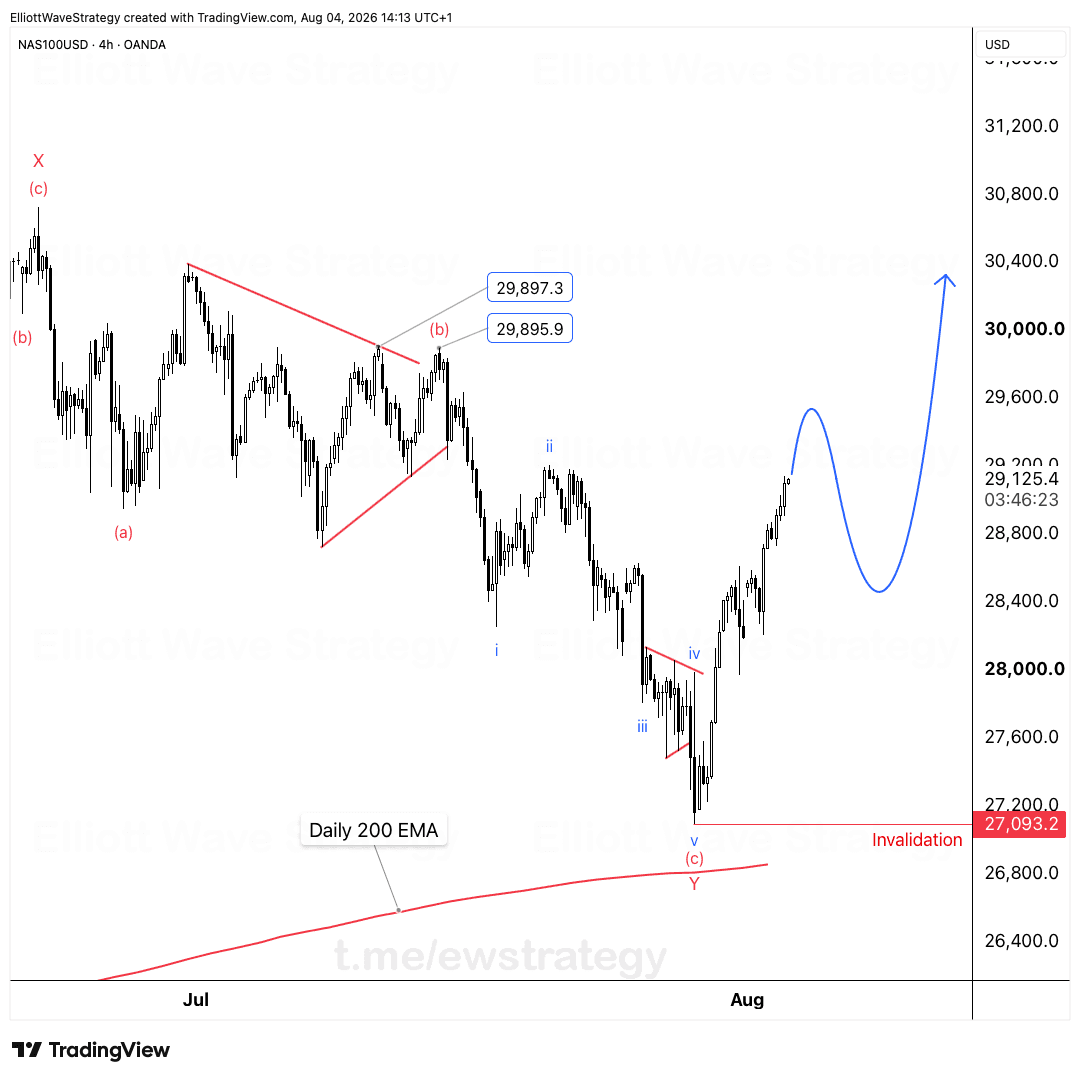
This isn't a guess based on one green candle. The prior decline into wave 2 traced a corrective (a)-(b)-(c) sequence, complete with a contracting triangle in wave (b). That triangle is a classic sign of a corrective pattern running out of steam, not a fresh leg down building momentum. Once price broke out of it, the case for a new impulse higher got stronger.
Where does US100 wave (3) target?
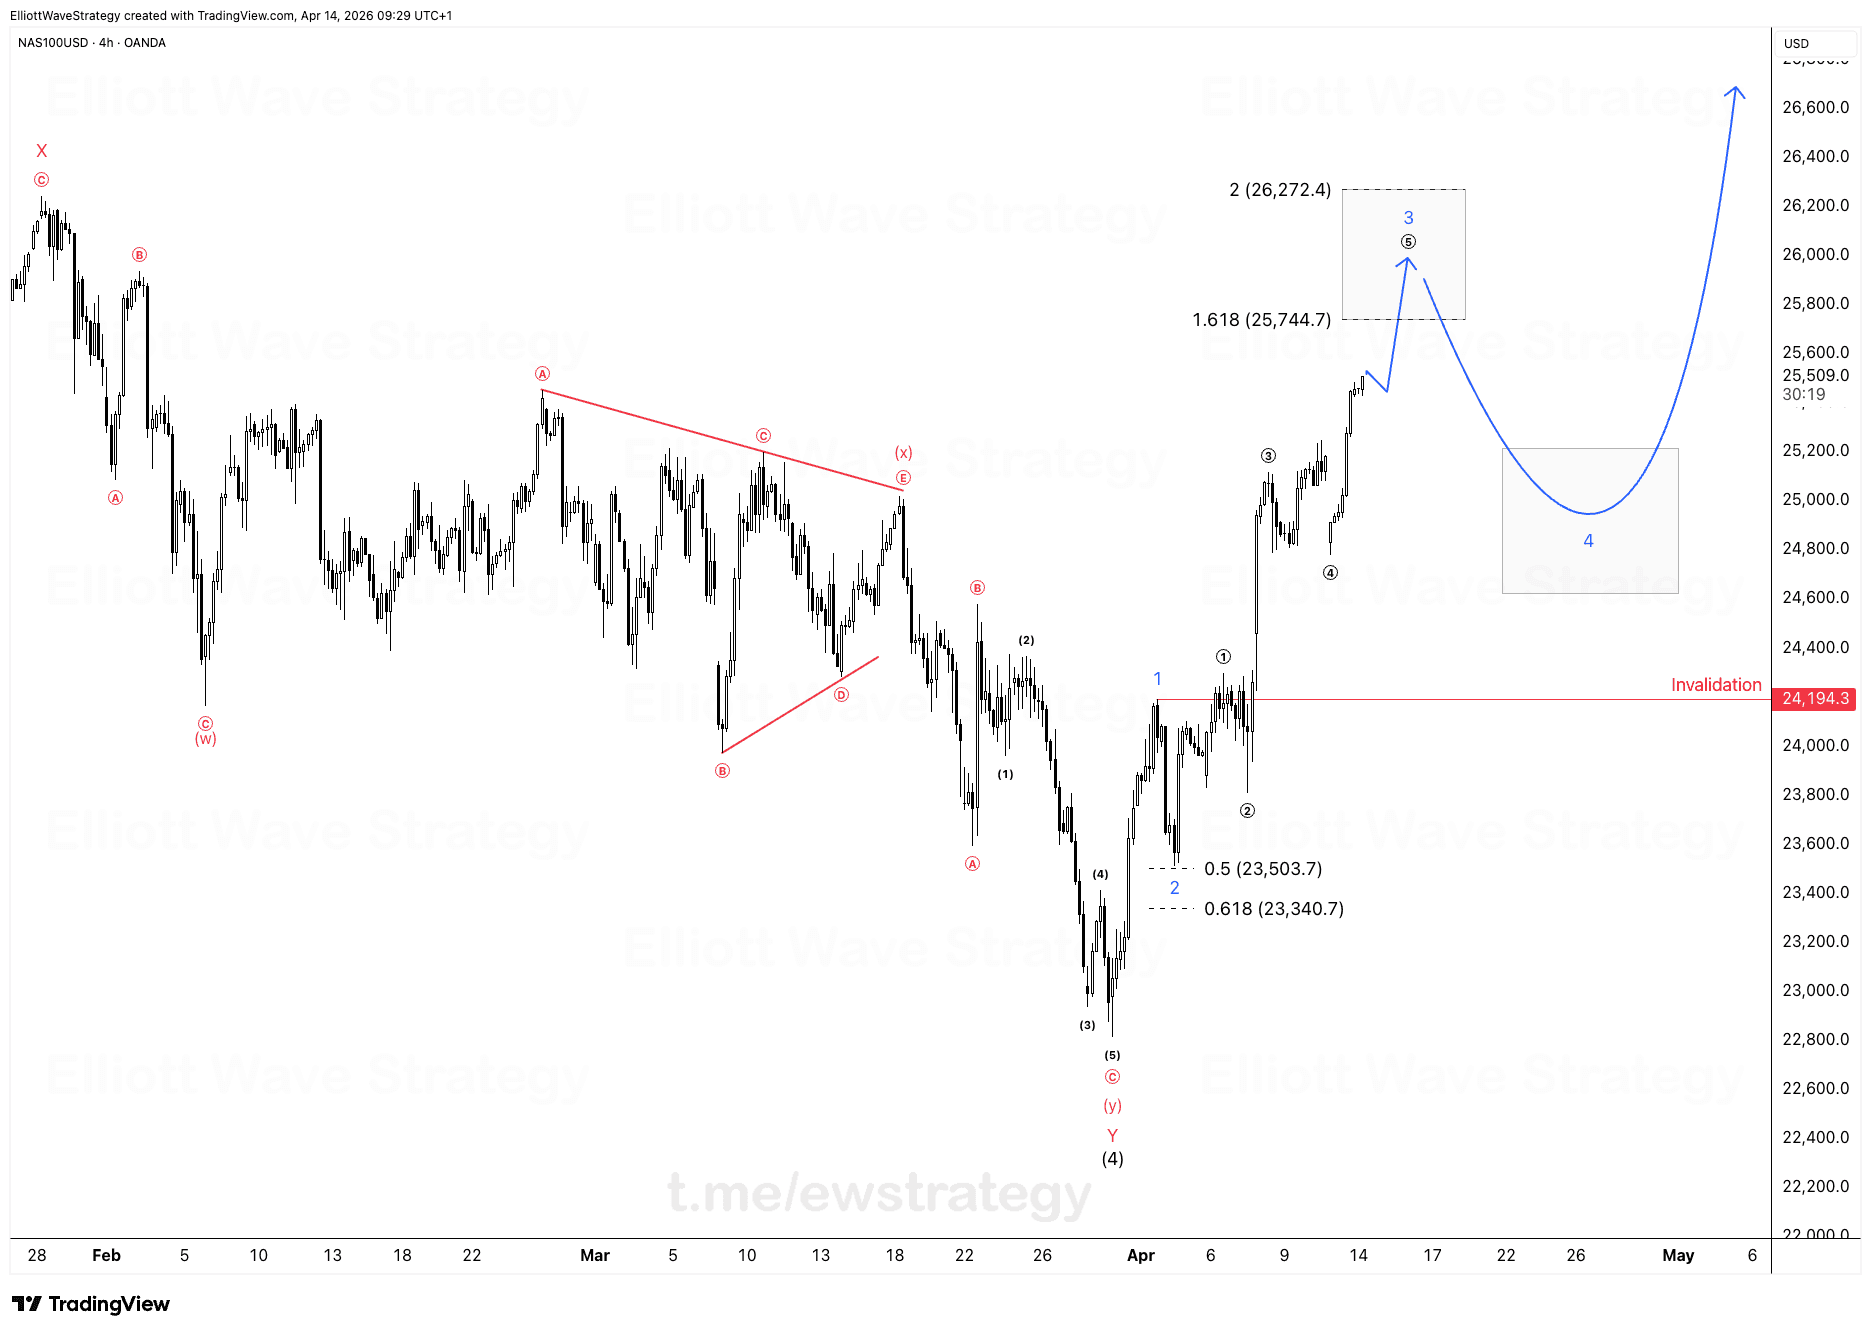
Wave (3) targets the 30,000-30,100 zone. That's the next leg up in the new five wave sequence, following wave (1) off the recent low.
Impulse waves rarely move in a straight line, and wave (3) is usually the strongest, most extended leg in the sequence. The chart shows this as a clean push from wave (2) up toward that 30,000-30,100 area, with the 2.618 Fibonacci extension marked right in that zone.
Why does US100 need a wave (4) pullback?
Wave (4) pulls back to reset before the final leg. Why even draw a pullback on a bullish chart? Because five wave moves don't go in a straight line.
Wave (4) isn't weakness. It's the pause that sets up the last push. Traders who panic-sell every dip inside an impulse end up chasing the top instead of riding it. The chart marks the wave (4) low near the 2.0 Fibonacci level, right below the wave (3) high, which is exactly where a fourth wave should sit without overlapping wave (1) territory.
What happens after US100 wave (5) hits 30,500?
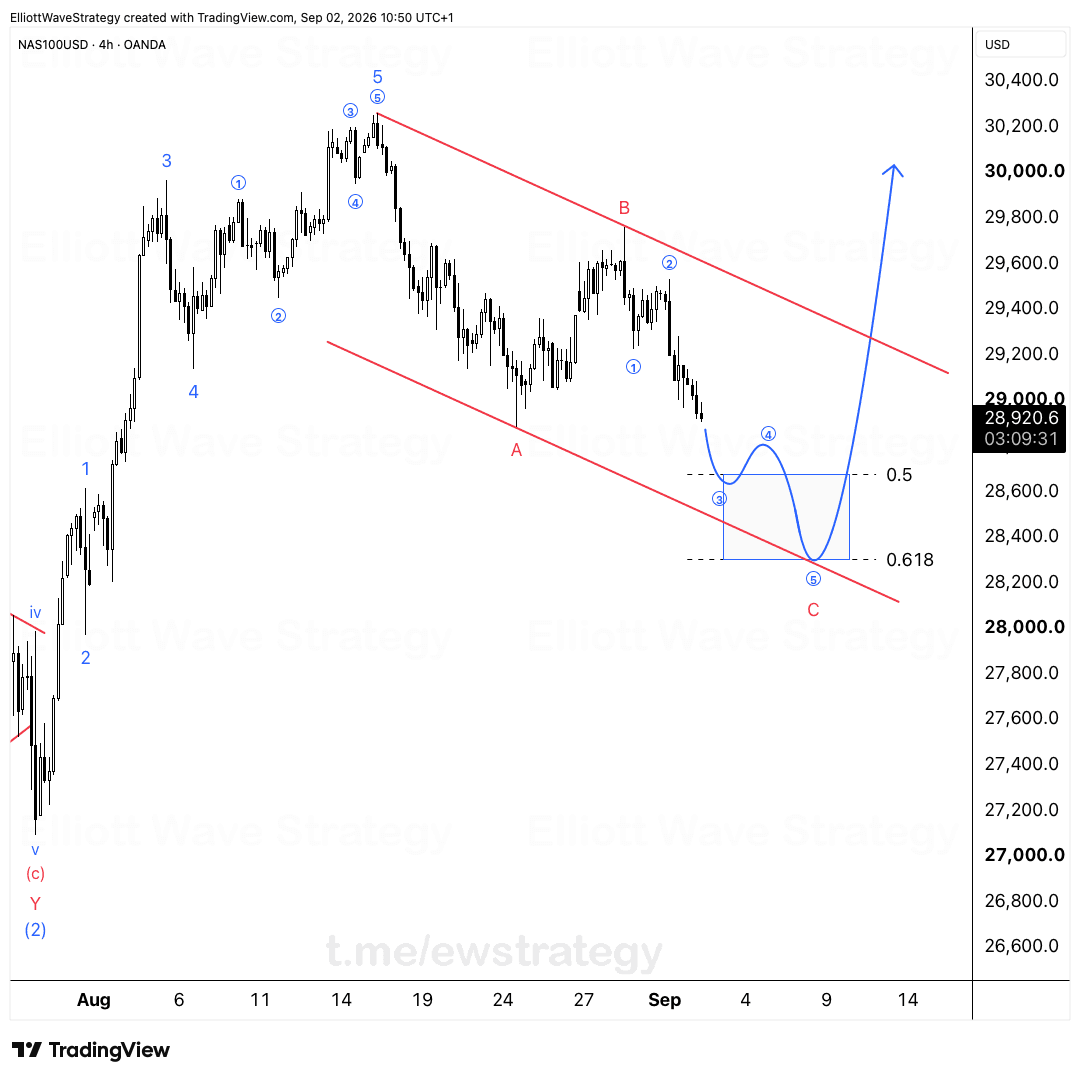
Wave (5) then extends toward 30,500, completing the five wave impulse that began after wave 2 bottomed. This is labeled wave 1 of the next higher degree on the chart, meaning it's just the first leg of something bigger.
Once this five wave sequence wraps up near 30,500, expect a bigger correction to follow. That's wave 2 of one degree higher, shown on the chart curving back down toward the 29,600-29,700 area. A correction at that stage doesn't kill the trend. It resets it, the same way the current wave 2 did before this rally started.
Final word
Save this chart and follow the next update. The structure is doing the talking here, not us. US100 is tracing a textbook impulse-correction rhythm, and each piece, wave (3), wave (4), wave (5), and the correction that follows, has a specific job to do inside that rhythm.
Key Takeaways
- •US100 completed a corrective wave 2 decline in an (a)-(b)-(c) pattern, including a contracting triangle in wave (b).
- •US100 wave (3) targets the 30,000-30,100 zone based on the 2.618 Fibonacci extension.
- •Wave (4) on US100 is expected to pull back and reset before wave (5) extends toward 30,500.
- •Once US100 completes this five wave sequence near 30,500, a larger degree wave 2 correction is expected to follow.
- •A wave 2 correction of higher degree does not end the US100 uptrend, it resets it for the next impulse.
Frequently Asked Questions
What is the US100 Elliott Wave count right now?
US100 has completed a corrective wave 2 low and is now in a new five wave impulse, currently working through waves (3) and (4) on the way toward a wave (5) target near 30,500.
Why does Elliott Wave theory expect a pullback in wave (4)?
Impulse waves move in five legs, with waves (2) and (4) acting as corrective pauses that let the trend reset before the next push. Wave (4) pulling back is normal structure, not a sign the rally is failing.
What would invalidate the bullish US100 count?
If wave (4) drops back into the price territory of wave (1), the impulse count would be invalidated since fourth waves cannot overlap first waves in a standard motive sequence.
Disclaimer: This analysis is for educational purposes only and does not constitute financial advice. Elliott Wave analysis involves subjective interpretation. Always do your own research and manage your risk accordingly.
Get Full Coverage for All 27 Instruments
Premium members receive daily wave counts with entry zones, targets and invalidation levels, published daily across all 27 instruments.
View Premium Plans