XAUUSD Elliott Wave: Gold Still Falling, Bottom Not Confirmed
Everyone keeps telling me gold is going higher. Keep calling the bottom and you'll have something to celebrate when it finally rallies. Convenient, as long as w
Everyone keeps telling me gold is going higher. Keep calling the bottom and you'll have something to celebrate when it finally rallies. Convenient, as long as we forget how far it fell while the correction was supposedly "over."
I'm not here to join that crowd. I'm here to read the structure.
Is gold still in a downtrend?
Yes. XAUUSD is still inside the falling channel that started in January, after the high at 5,598.750. Price has respected that channel for months, with the upper boundary capping every rally and the lower boundary catching every flush.
The trend is your friend, and that applies when it points down too. A rally inside a falling channel is a correction until price proves otherwise. Right now it has not proved anything.
Where does the Elliott Wave count say the decline ends?
I do think this decline is getting close to its end. But there are two ways to count it, and I treat both seriously.
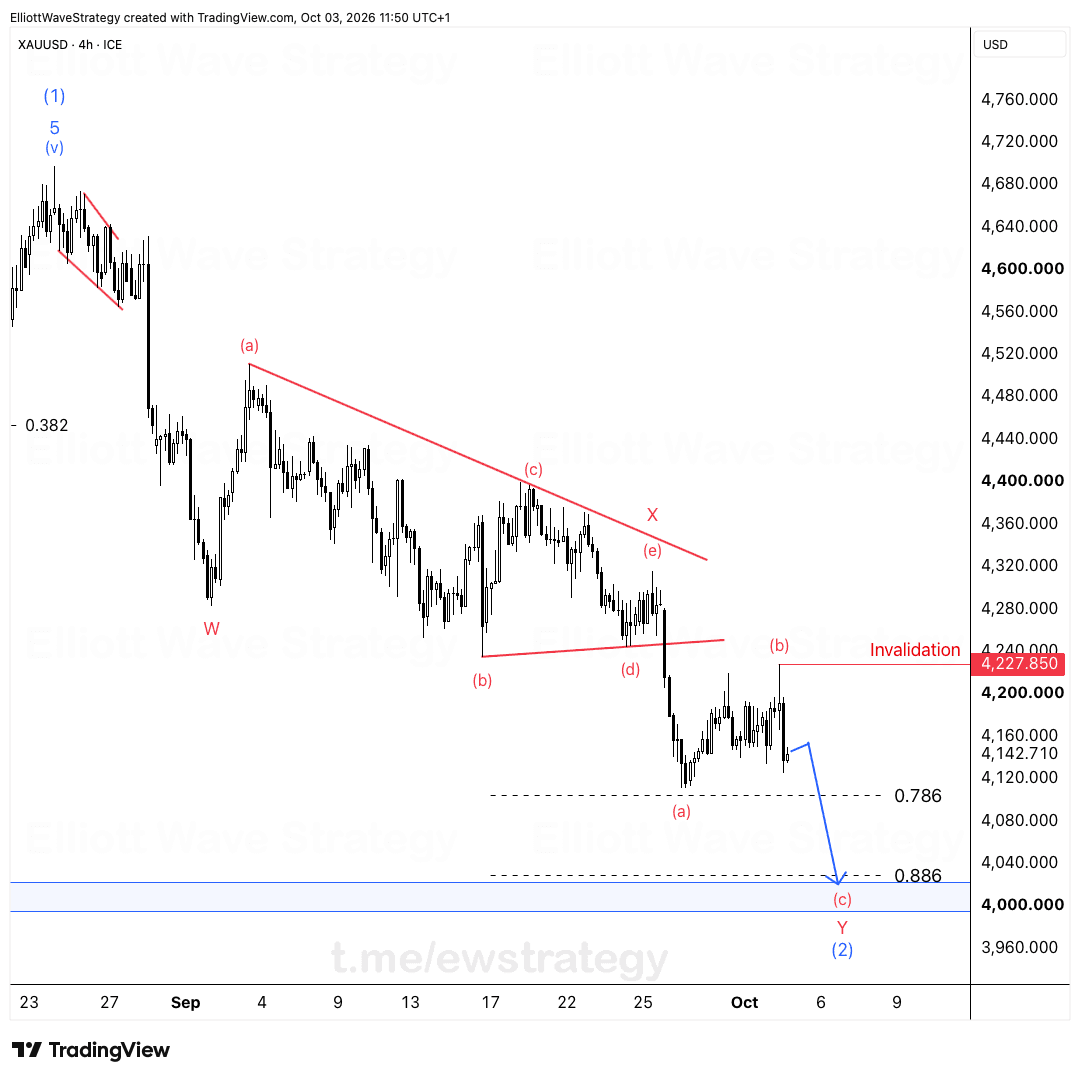
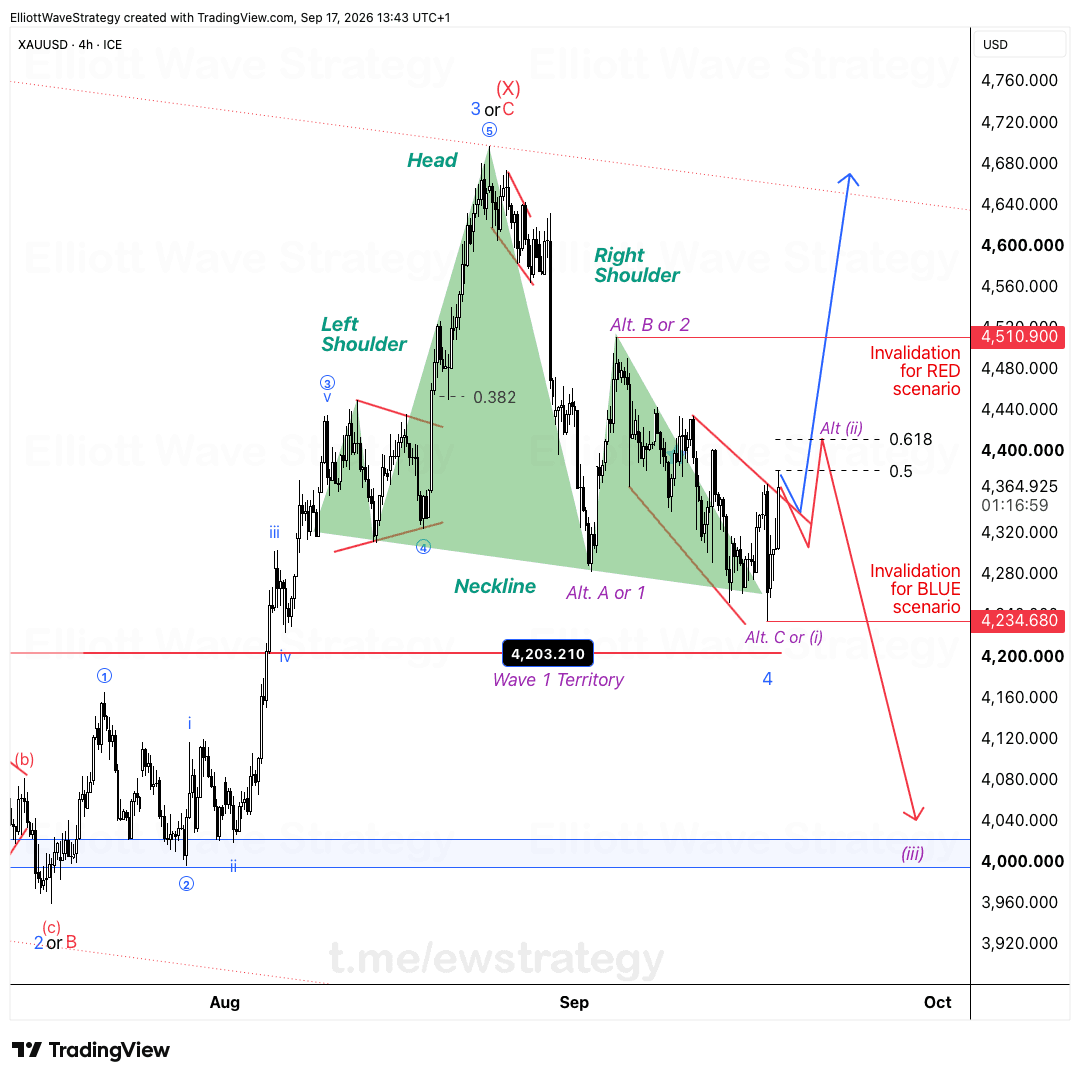
The primary count has wave C of (2) finishing around 4,000. On the chart, the red decline from the 4,400 area is working through the final leg of a correction that began after the recent high labeled C or (1). A low near 4,000 would complete wave (2) and set up a new advance.
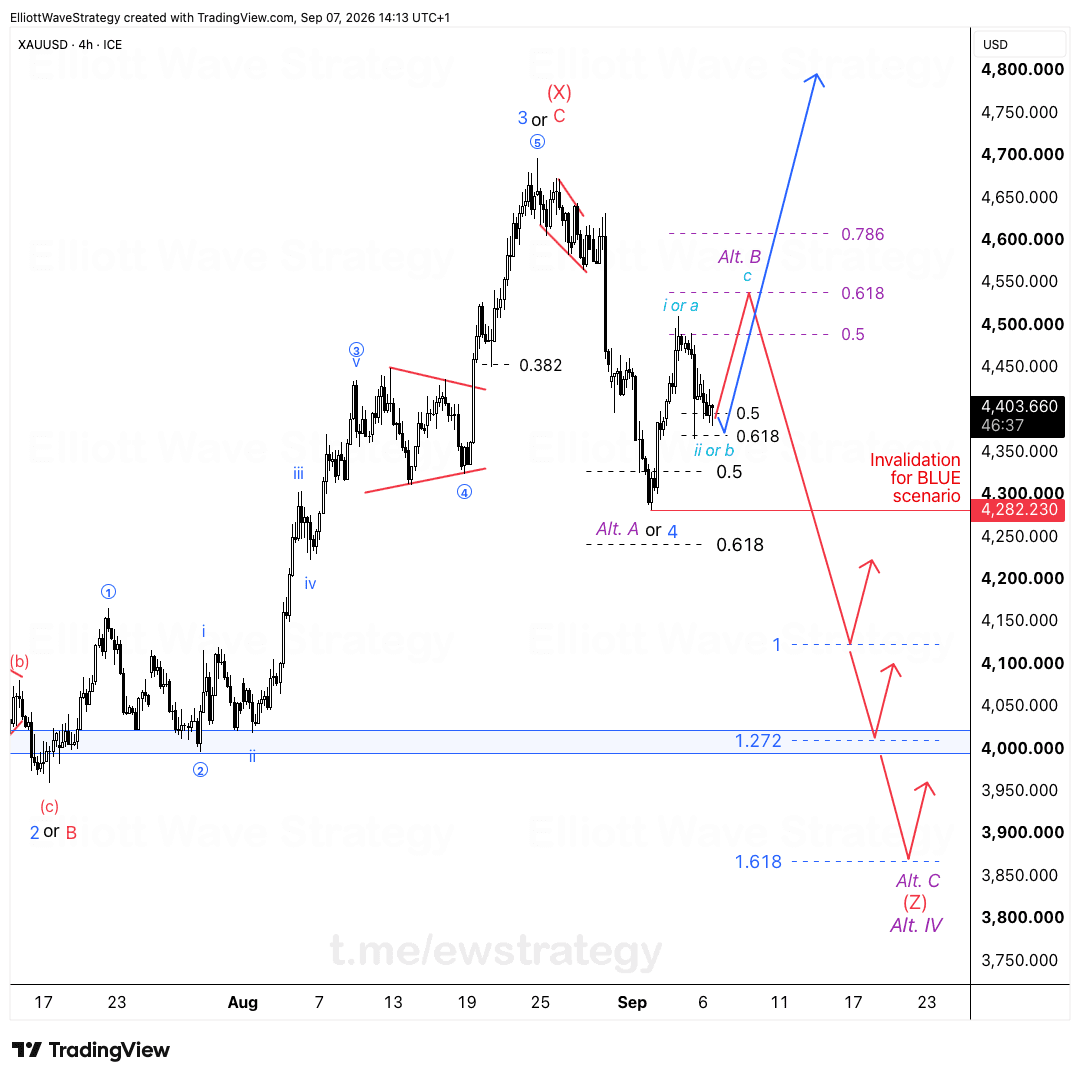
The alternative is that wave IV is not done and stretches toward 3,800-3,900. Here the larger correction labeled (W)-(X)-(Y)-(Z) extends with a final leg lower, and the lower channel line is the natural target. Same structure, deeper low.
If price slices through 4,000 without a reaction, the alternative becomes the working count. That is how I keep both on the table without marrying either.
Does an upward arrow confirm the bottom?
No. Drawing an upward arrow on a chart does not confirm a bottom, and mine are not an entry signal. They show where price could go if the count is right.
What I want to see is simple. First, an impulse up from the low, not just a bounce. Second, a pullback after it that holds above the starting point. Only then do I start looking for a long.
That sequence is slower and I will miss the exact low. Fine.
Why not just keep calling the bottom?
Because it gets expensive. Every early call that fails costs real money, and a rally later does not make those earlier calls right. Being early and being right are not the same thing, and the market does not pay you for the second one when you only delivered the first.
I am fine with missing the exact low. A confirmed turn at a slightly worse price beats a series of guesses at the best one.
Gold may well be close to a low. Until the structure says so, the channel is still pointing down, and I trade what the chart shows, not what the crowd hopes.
Key Takeaways
- •XAUUSD remains inside the falling channel that began in January, so the dominant trend is still down.
- •The primary Elliott Wave count for XAUUSD puts the end of wave (2) around 4,000.
- •The alternative XAUUSD count lets wave IV extend toward 3,800-3,900 before a larger advance begins.
- •A bottom in gold is not confirmed until a first impulse up is followed by a pullback that holds.
- •Missing the exact low in XAUUSD is an acceptable cost compared with repeatedly catching falling knives.
Frequently Asked Questions
Where is the XAUUSD Elliott Wave count looking for a low?
The primary count expects wave (2) to end around 4,000. The alternative count lets wave IV extend toward 3,800-3,900 before the decline is finished.
How do you confirm a bottom in gold using Elliott Wave?
Wait for the first impulse up from the low, then watch the next pullback. If that pullback holds, the turn gains credibility. An arrow on a chart is a projection, not a confirmation.
Is XAUUSD still in a downtrend?
Yes. Gold is still trading inside the falling channel from January, with the high at 5,598.750 as the starting point. Until price breaks and holds above that channel, rallies remain corrections inside the decline.
Disclaimer: This analysis is for educational purposes only and does not constitute financial advice. Elliott Wave analysis involves subjective interpretation. Always do your own research and manage your risk accordingly.
Get Full Coverage for All 27 Instruments
Premium members receive daily wave counts with entry zones, targets and invalidation levels, published daily across all 27 instruments.
View Premium Plans