XAUUSD Elliott Wave: Why Gold's Low May Come Near 3,500
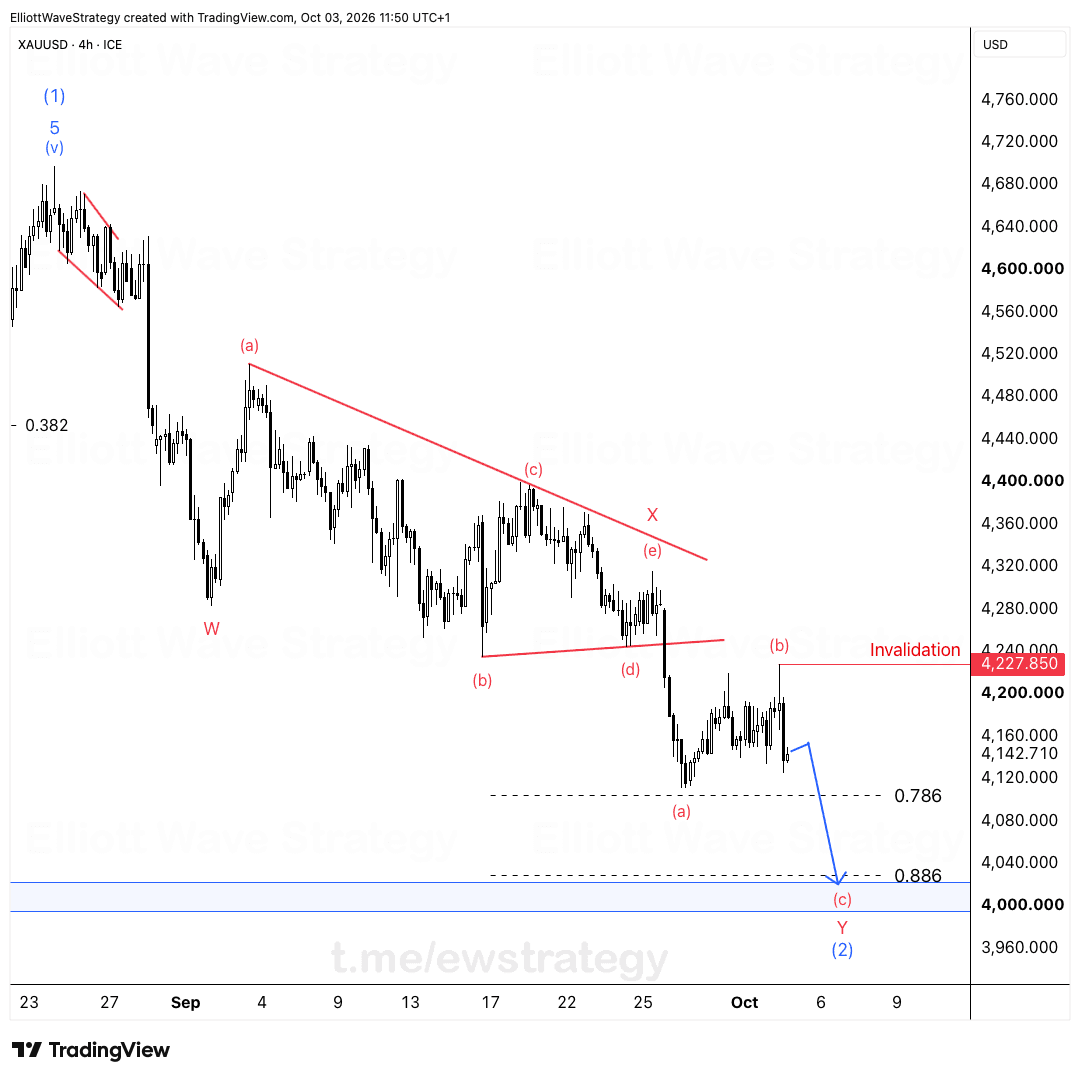
My message since early October hasn't changed. Everyone wants to call the bottom in gold. I don't. Price rejected 4,228 on October 3, wave ⑤ kept pointing at 4,
Everyone wants to call the bottom in gold. I don't.
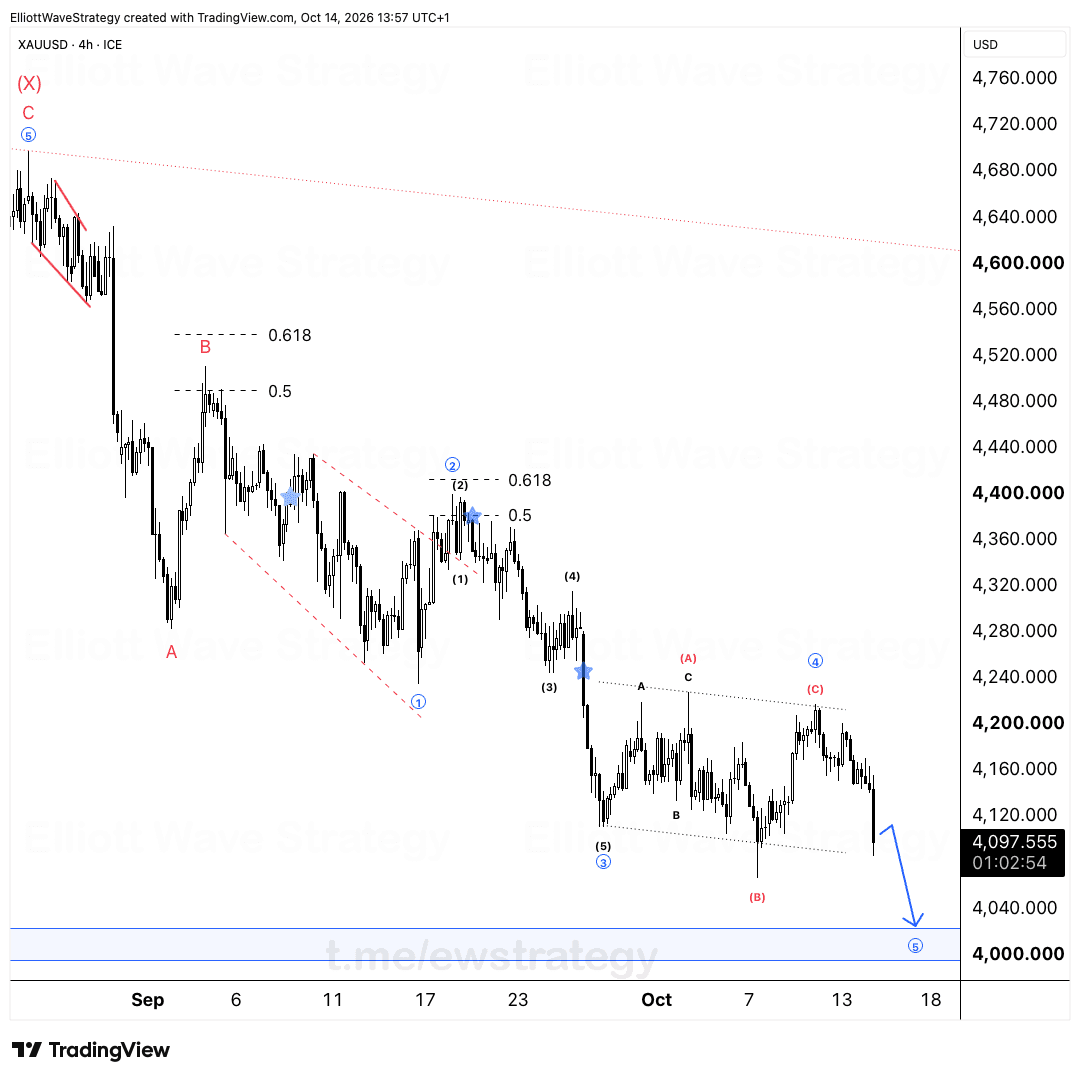
My message since early October hasn't changed. Price rejected 4,228 on October 3, wave ⑤ kept pointing at 4,000 on the 14th, and today gold slipped under the October triangle.
This is the second of two charts I'm watching on XAUUSD. The open question is not whether gold reaches the yellow box just under 4,000. The question is what happens after it.
What does the bearish XAUUSD Elliott Wave count look like?
In this count, the yellow box only gives a bounce. That bounce is the D leg of a bigger triangle, the red wave (X) structure drawn on the chart, with the upper trendline falling from wave A through wave C.
Wave E then follows near 4,300. The chart shows the E leg peaking just above that level before the structure rolls over again.
The real low of wave IV comes early next year, well below the box, around 3,500. The blue path on the chart bottoms at wave IV near the 3,400 to 3,600 zone, with a lower-high bounce on the way down.
Why is the yellow box not the end of wave IV here?
Because a box is just an area where price can react. It does not tell you what the reaction is.
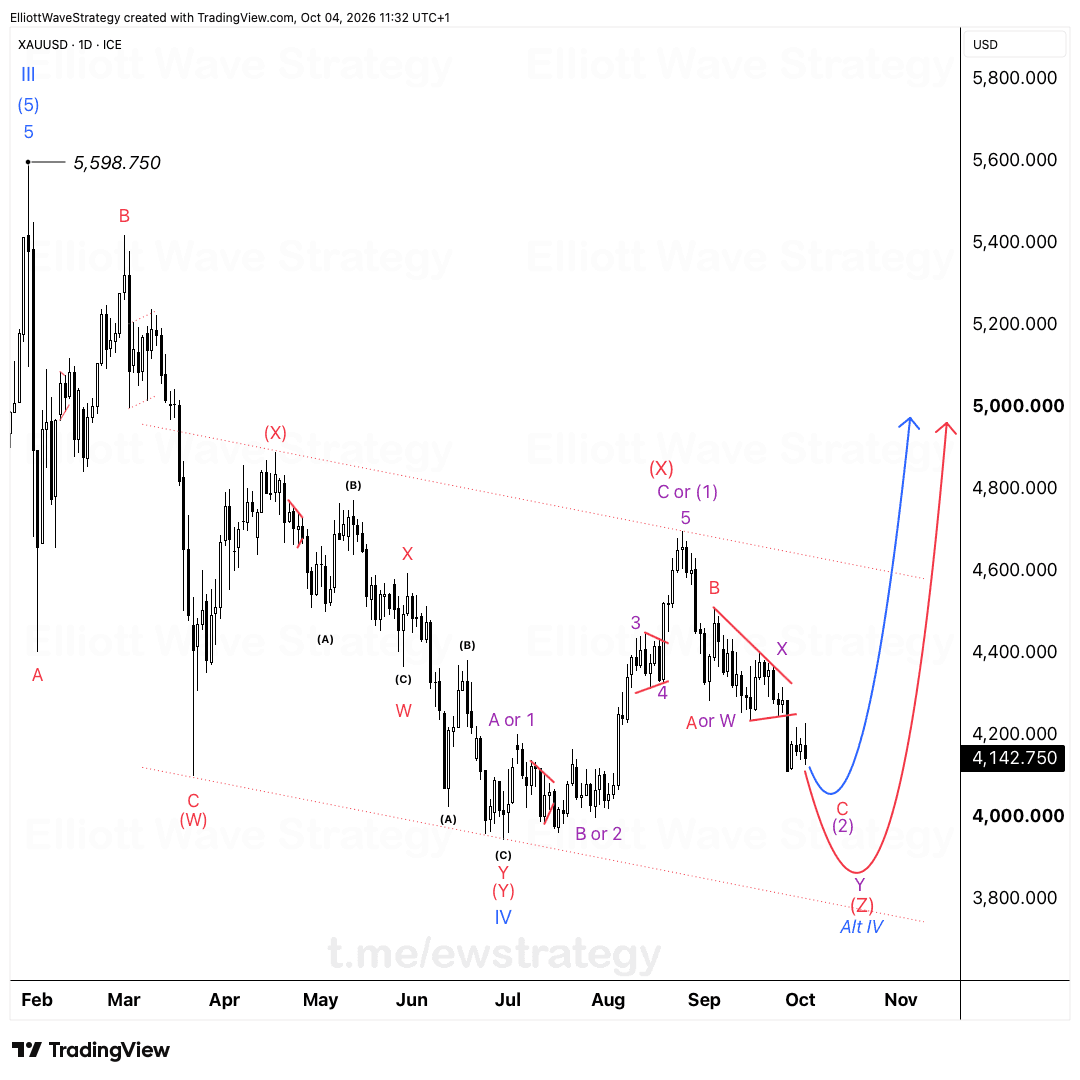
In this count, wave IV is a bigger, more complex correction after the wave III top at 5,598.750. Complex corrections take time. They overlap, they chop, and they punish everyone who keeps calling the low early.
The October triangle break fits the idea that sellers are not finished. A drop out of that small triangle points toward the red line under 4,000, wave (c) of D, and the box sits right there.
What is the alternative count for gold?
The first chart has the box ending wave IV, with wave V starting from there. Same level, completely different story.
Both counts agree on the immediate target: the area under 4,000. They disagree on what comes after. That is why I keep both on the table instead of picking a favorite and defending it.
How will I know which XAUUSD count is right?
How price leaves the box settles it.
Five waves up points to the first count, the box ends wave IV and wave V is underway. A slow three-wave bounce points to this one, the D leg of the triangle, with wave E to follow and the real low still ahead.
No long for me without an impulse up and a pullback after it. Until then, a bounce is just a bounce.
The structure decides, not the hope. Watch the shape of the move out of the box, not just the direction.
Key Takeaways
- •XAUUSD may only bounce from the yellow box under 4,000, with that bounce being the D leg of a larger triangle in this Elliott Wave count.
- •In the bearish count, gold's wave E follows near 4,300 before the real wave IV low forms around 3,500 early next year.
- •How XAUUSD leaves the yellow box decides the count: five waves up favors the bullish wave V start, a slow three-wave bounce favors the bearish triangle.
- •Gold rejected 4,228 on October 3 and slipped under the October triangle, which keeps the focus on the area just under 4,000.
- •No long on XAUUSD without an impulse up and a pullback after it, because a bounce alone does not confirm that wave IV is finished.
Frequently Asked Questions
Is gold's wave IV finished at 4,000?
Not in this count. The yellow box under 4,000 is treated as a bounce area, the D leg of a bigger triangle, with the real wave IV low around 3,500 early next year.
How can traders tell the two XAUUSD Elliott Wave counts apart?
By how price leaves the yellow box. Five waves up supports the count where the box ends wave IV and wave V starts. A slow three-wave bounce supports the triangle count with a lower low to come.
Where does the bearish XAUUSD count expect wave E to end?
Near 4,300, according to the chart. Wave E follows the D leg bounce from the box and precedes the final decline into the wave IV low around 3,500.
Disclaimer: This analysis is for educational purposes only and does not constitute financial advice. Elliott Wave analysis involves subjective interpretation. Always do your own research and manage your risk accordingly.
Get Full Coverage for All 27 Instruments
Premium members receive daily wave counts with entry zones, targets and invalidation levels, published daily across all 27 instruments.
View Premium Plans