XAUUSD Elliott Wave: Gold Bounce Is Wave B, Not a Turn
The gold downtrend we called kept going. Congrats to every Premium member who traded it with us. 🎯
The gold downtrend we called kept going. Price made a new low this week. Red candle after red candle, and the finger hovered over buy. "It can't go lower." It did.
Now the bounce is here. Green candles, and it starts to feel like the trend has turned. I don't buy it.
Is the gold bounce a reversal or wave B?
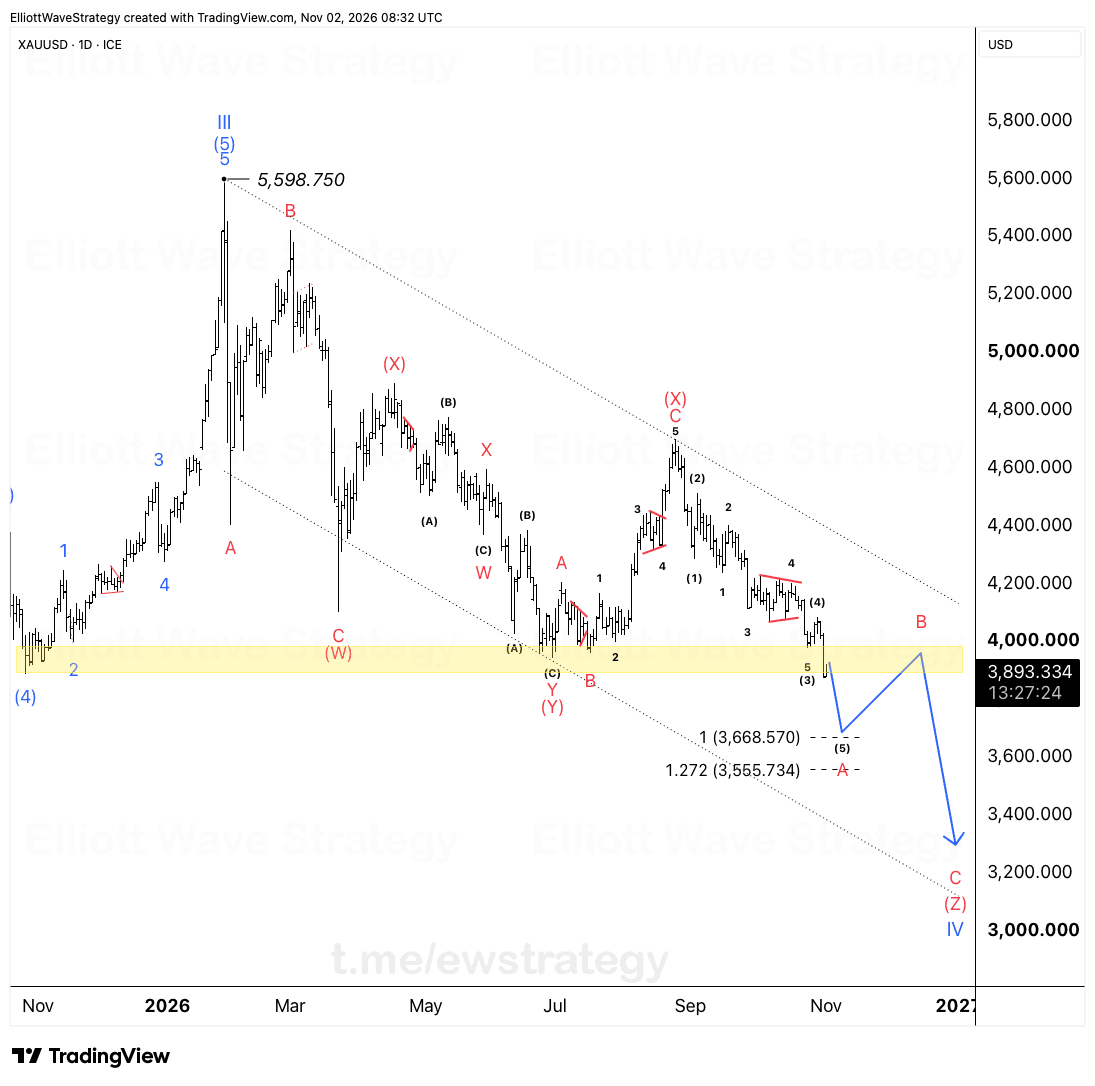
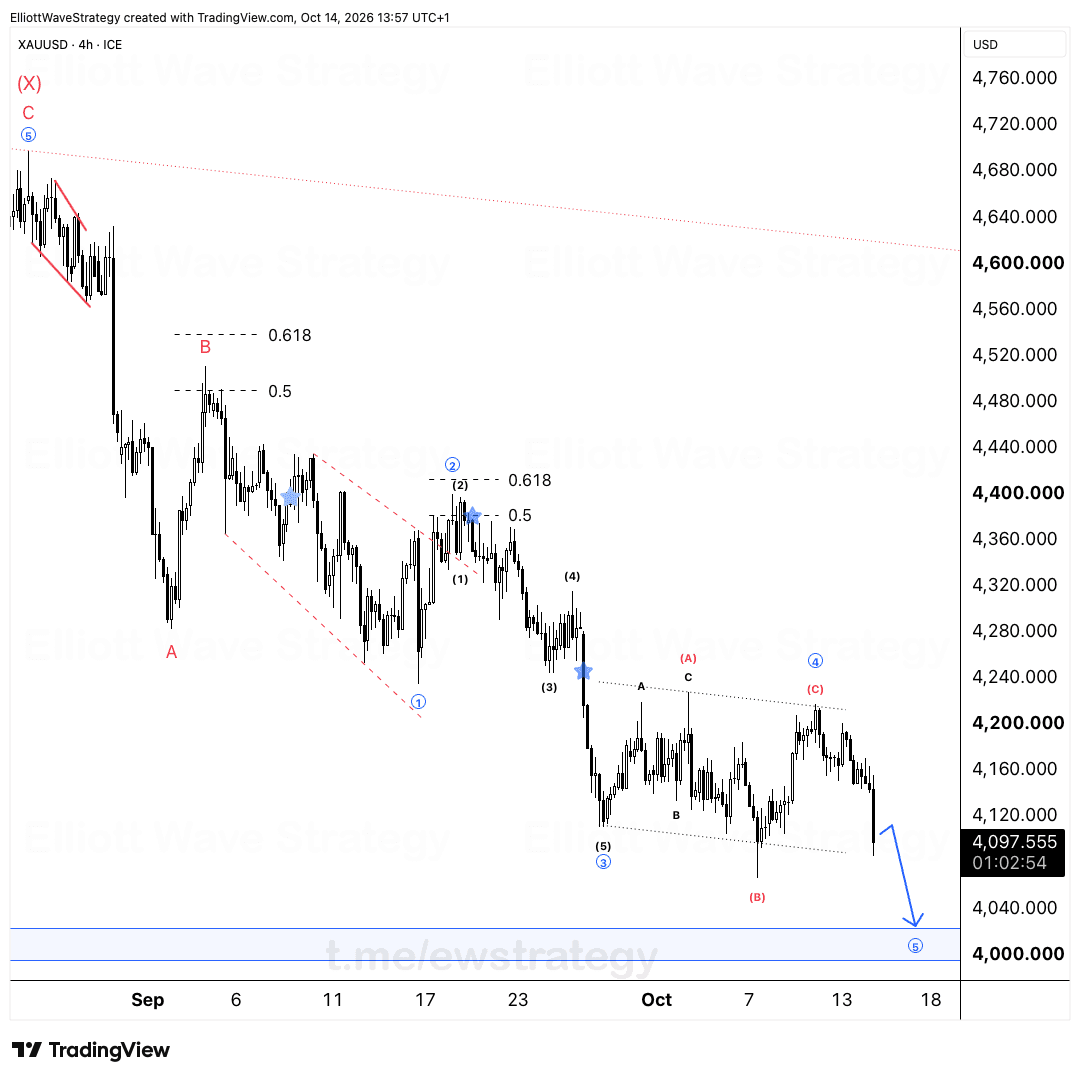
My count says wave A is done. The decline from the 5,598.750 top ended with a five-wave structure, labeled i through v on the chart, and wave A sits at the bottom of it.
That means the current rise is still a correction. Wave B. It is a pause inside a larger downtrend, not the start of a new uptrend.
Green candles make people feel like something changed. Structure says otherwise.
Why does wave B in gold matter after a five-wave drop?
Five waves down is a motive decline. In Elliott Wave terms, a motive move is followed by a corrective move against it, and after that the larger trend resumes. The bounce is that corrective move.
The mistake traders make here is simple. They see a sharp rally off a low and read it as a turn, because the last few days of price action are all they are looking at. The wave count looks at the whole sequence.
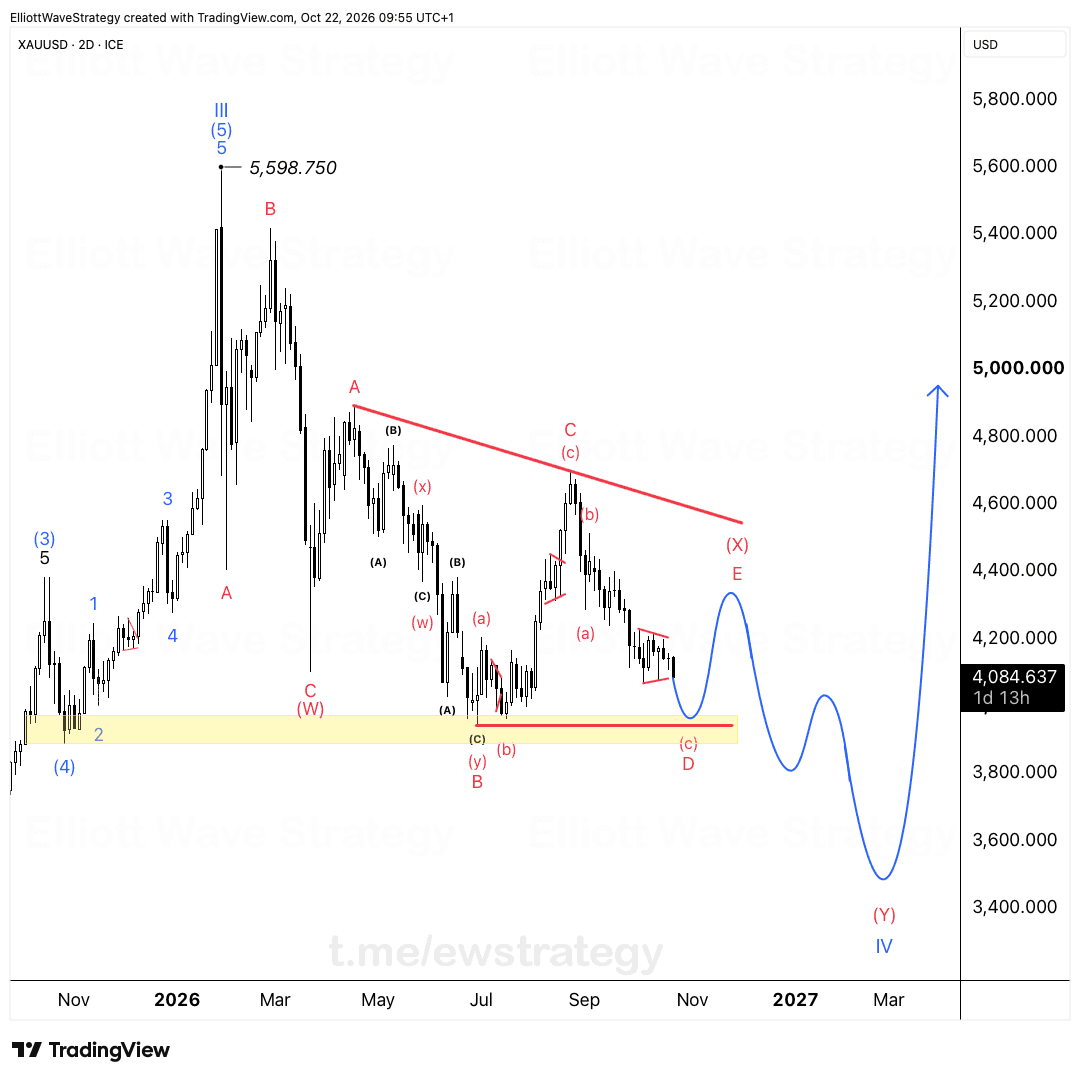
This chart has already shown how gold corrects. The decline from the top has been a series of corrections inside a falling channel, with the red (W), (X), (Y) and a second (X) all labeled. Those corrections did not fly. They chopped, overlapped and wasted time.
What should wave B look like on the XAUUSD chart?
It may chop sideways like the last one on this chart. Do not expect a clean, fast move. Corrections in this market have been slow, overlapping and frustrating, and wave B can follow the same pattern.
I am watching the yellow zone near 4,000. That area acted as support during the earlier part of the decline, and price broke through it on the way down. A rally back into it is where wave B has room to complete.
The blue path on the chart shows the idea: a rise into the yellow zone, then a turn lower for wave C. It is a projection of how the count could behave, not a promise of where price will go.
What invalidates this gold count?
If price gets back above 4,282.720, the count is wrong. That level is marked on the chart as the invalidation line.
A move above it would break the bearish structure and force a new count. I do not argue with invalidation levels. If price takes it out, the analysis is done and I start over.
That is the point of having a level. It tells you when you are wrong before the market does it for you.
What this means for traders
The hardest part of a trend is the moment after a new low, when the rally looks convincing. That is where traders talk themselves out of the structure.
The count is clear. Wave A is done, wave B is in progress, and 4,282.720 decides whether the idea holds.
Key Takeaways
- •XAUUSD completed a five-wave decline labeled wave A from the 5,598.750 top, so the current bounce is read as a corrective wave B.
- •The XAUUSD Elliott Wave count is invalidated if price trades back above 4,282.720.
- •Gold's earlier corrections inside this decline were slow and overlapping, so the XAUUSD wave B may chop sideways rather than rally cleanly.
- •The yellow zone near 4,000 is the area to watch on XAUUSD, because it was support before price broke through it on the way down.
- •Green candles after a new low in gold do not confirm a trend change; the wave structure decides that.
Frequently Asked Questions
What invalidates the bearish XAUUSD Elliott Wave count?
A move back above 4,282.720 invalidates the count. That level is marked as invalidation on the chart, and a break above it would require a new wave count.
Why is the gold rally considered wave B and not a new uptrend?
The decline into the recent low completed a five-wave structure, which marks wave A. A bounce after that is read as a corrective wave B inside the larger downtrend until price proves otherwise.
Where is gold wave B expected to run?
The yellow zone near 4,000 is the area being watched. Wave B may chop sideways there, as the previous correction on this chart did.
Disclaimer: This analysis is for educational purposes only and does not constitute financial advice. Elliott Wave analysis involves subjective interpretation. Always do your own research and manage your risk accordingly.
Get Full Coverage for All 27 Instruments
Premium members receive daily wave counts with entry zones, targets and invalidation levels, published daily across all 27 instruments.
View Premium Plans