US100 Elliott Wave: Wave (3) Extends Toward 2.618
Nasdaq is moving higher, exactly the direction we called out on Friday.
Nasdaq is moving higher, exactly the direction called out on Friday. No surprises there. The market is doing what the count said it would do.
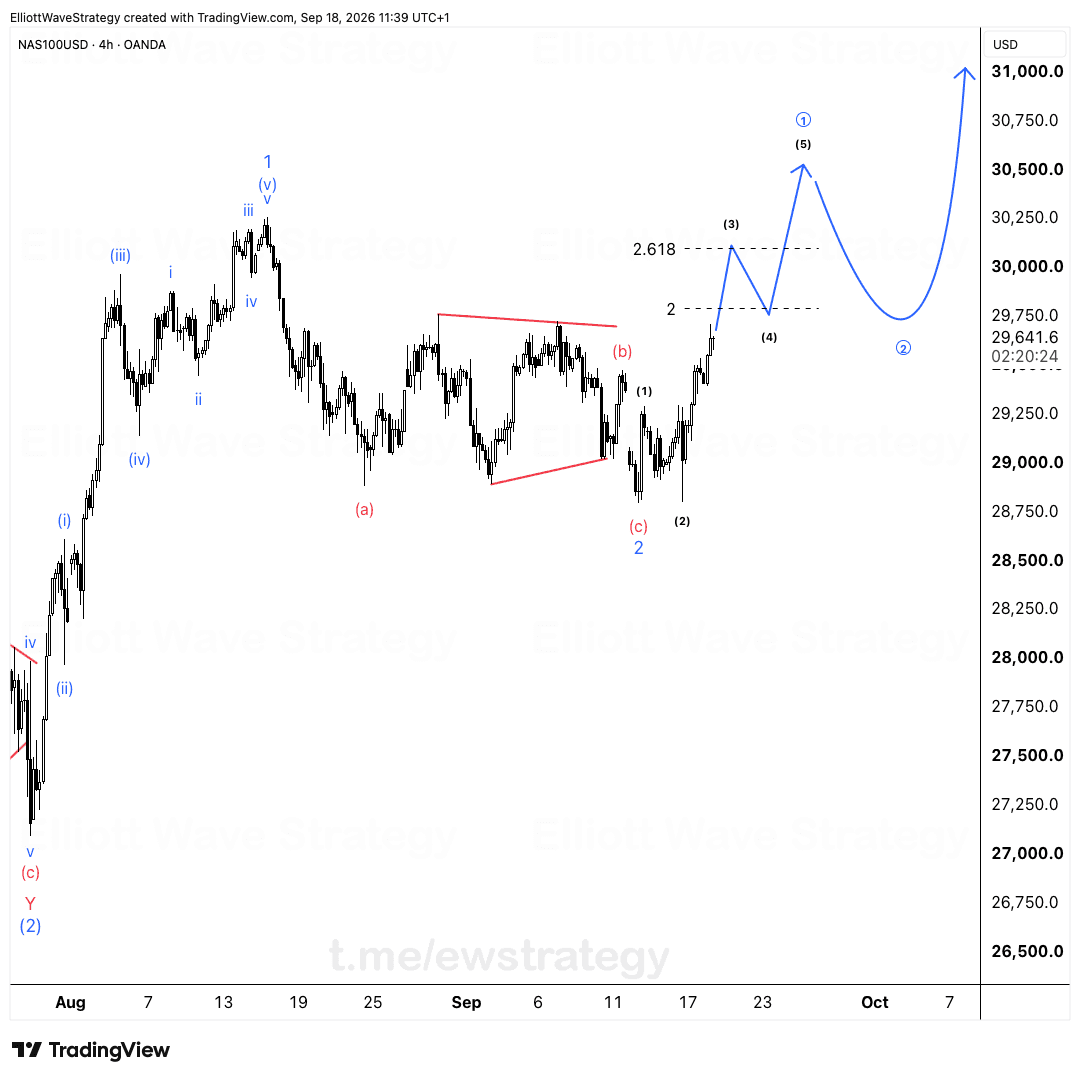
But trends don't move in a straight line, and anyone expecting a clean vertical line to new highs is going to get shaken out. Wave (3) is extending toward the 2.618 extension on the 4h chart, and once that impulse wraps, the next phase isn't more upside. It's a pullback.
Where is US100 in its wave count right now?
Look at the chart. Wave (1) and wave (2) are already in place, low near 28,800 for wave (2), and wave (3) is currently stretching upward, tracking toward the 2.618 extension level. That's the extended wave in this five-wave impulse, labeled circle 1 on the higher degree.
This lines up with the broader structure too. Zoom out and you'll see wave (b) formed as a contracting triangle before wave (c) dropped into wave 2 of the larger degree. The move up since then is wave 1 of the next impulse, and wave (3) is the meat of it.
Why does wave (4) matter more than wave (3) right now
Here's the part traders skip past. Once wave (3) finishes its run at the 2.618 extension, wave (4) has to happen. That's not optional, it's how impulses are built.
The shaded zone on the chart marks the 0.236 to 0.382 retracement, right around the 29,800 to 30,000 area based on the drawn levels. That's the zone being watched. If wave (4) develops there, that's where the internal structure gets dug into for clues on the next leg.
Wave (4) corrections are notorious for chopping sideways or faking a bigger drop before resuming. Traders who mistake wave (4) noise for a trend reversal end up on the wrong side of wave (5).
What does the blue path actually represent
The blue path drawn on the chart is a working scenario, not a confirmed sequence. It shows wave (4) pulling back into the shaded zone, then wave (5) launching toward roughly 31,000, completing circle 1 of this larger degree. After that, the drawn path shows a deeper pullback into circle 2 before the next leg starts building again.
Wave (5) is the target. But the market has to build wave (4) first. Forcing an entry before that correction plays out is trading hope, not structure, and hope isn't a strategy.
What should traders watch next
Save this chart. Compare it against the next candles as they print, and update the count as price gives more to work with. That's how Elliott Wave analysis actually works: level by level, wave by wave, not by guessing the ending before the middle is even done.
US100 is respecting the impulse so far. The 2.618 extension on wave (3) is the current focus, and the 0.236 to 0.382 zone is where wave (4) gets its test.
Key Takeaways
- •US100 is extending wave (3) toward the 2.618 Fibonacci extension on the 4h chart.
- •The 0.236 to 0.382 retracement zone is where wave (4) of US100 is expected to develop before wave (5) begins.
- •Wave (5) targets new highs near 31,000, but only after wave (4) completes its correction.
- •The blue path on the US100 chart is a working scenario, not a confirmed Elliott Wave sequence.
- •Forcing a trade ahead of wave (4)'s completion on US100 is treated as trading hope, not structure.
Frequently Asked Questions
What is the current Elliott Wave count for US100?
US100 is in wave (3) of an impulse, extending toward the 2.618 Fibonacci extension, with wave (1) and wave (2) already completed on the 4h chart.
Where is wave (4) expected on the US100 chart?
The 0.236 to 0.382 retracement zone is being watched as the likely area for wave (4) to develop once wave (3) finishes its extension.
Is the wave (5) target for US100 confirmed?
No. The blue path showing wave (5) reaching new highs is a working scenario based on the current count, not a confirmed sequence, and it depends on how wave (4) forms.
Disclaimer: This analysis is for educational purposes only and does not constitute financial advice. Elliott Wave analysis involves subjective interpretation. Always do your own research and manage your risk accordingly.
Get Full Coverage for All 27 Instruments
Premium members receive daily wave counts with entry zones, targets and invalidation levels, published daily across all 27 instruments.
View Premium Plans