XAUUSD Elliott Wave: DXY Wave (4) Holds the Key
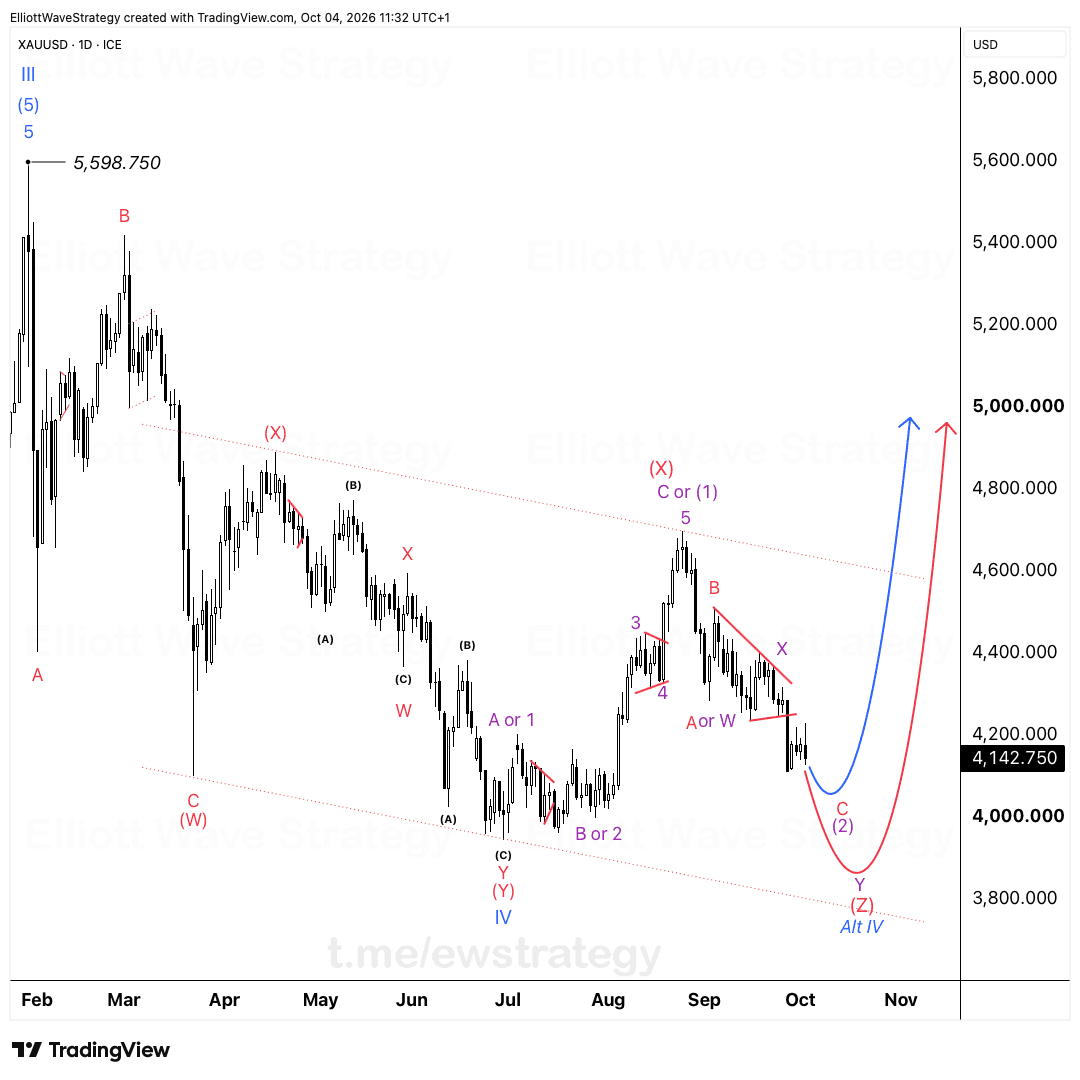
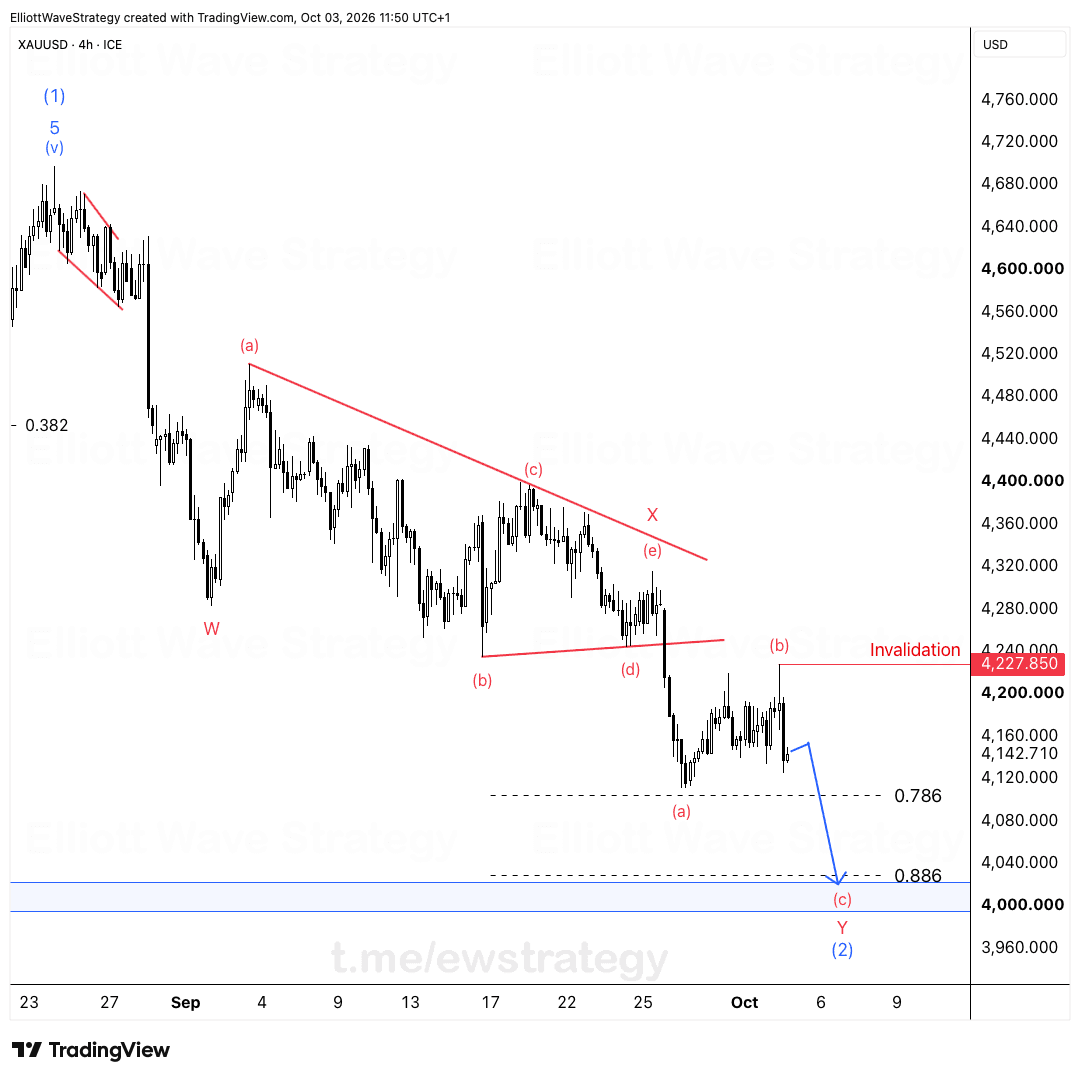
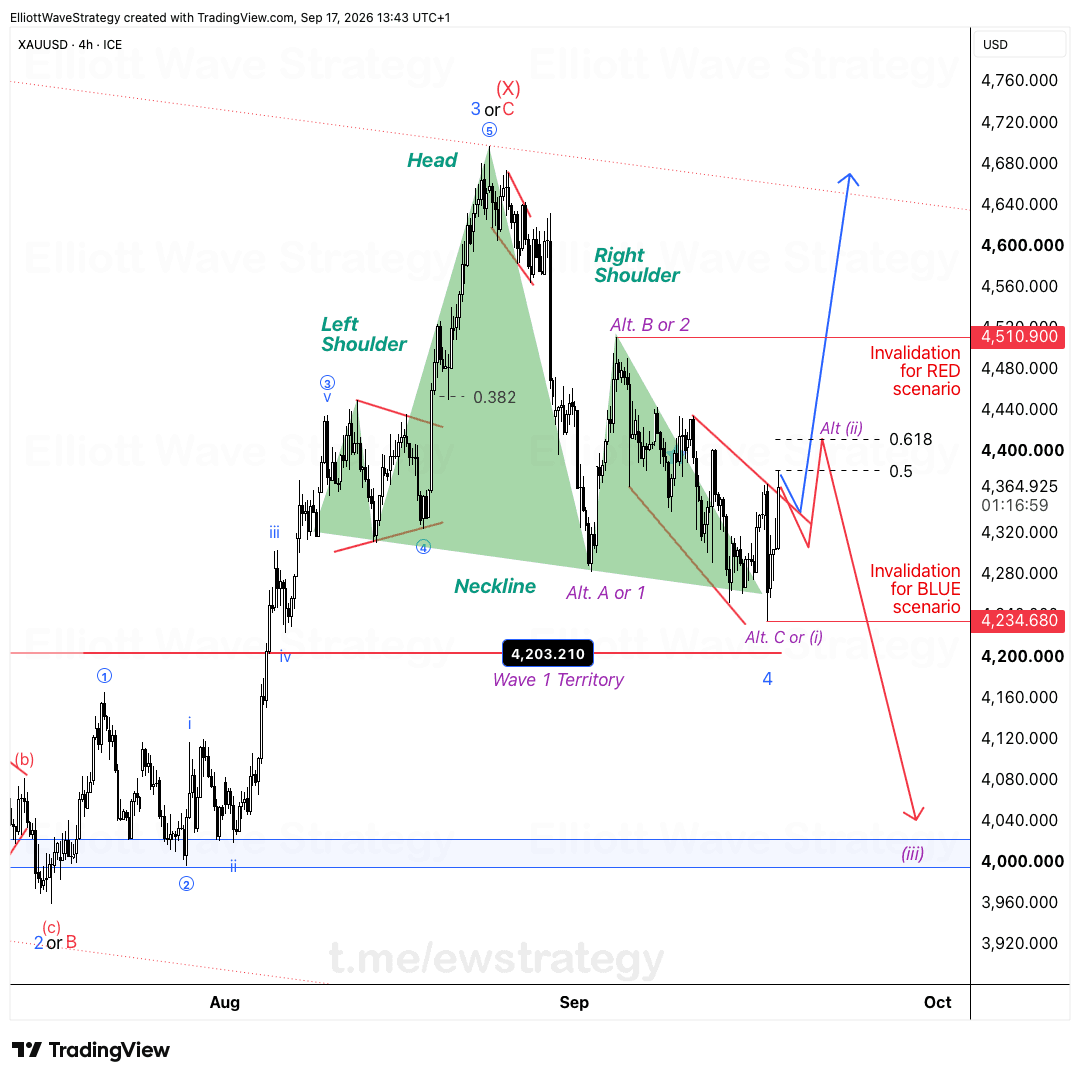
XAUUSD - https://s3.tradingview.com/snapshots/h/hZt4Samg.png
Every major pair has a lock right now. DXY is that key. Look at the Dollar Index chart and you'll see why gold's next move isn't really about gold at all.
The Dollar Index just finished Wave (3) at the highs and is now carving out a corrective Wave (4). Price tapped the 0.382 retracement at 100.877 and is currently holding above the 0.5 level at 100.592. Invalidation for this count sits at 100.558.
As long as that level holds, DXY is building the base for Wave (5) higher. And that changes the whole conversation for gold.
Why does DXY matter more than gold's own chart right now
Forget the XAUUSD chart for a second, this is a correlation problem. If the Dollar Index is gearing up for its final impulse higher, gold doesn't get a free pass to keep climbing.
A stronger DXY means headwinds for XAUUSD. That's the whole thesis. You can have a perfectly bullish looking gold chart and still get run over by a dollar rally, because the two don't move independently.
What the DXY wave count actually shows
The Dollar Index printed Wave (1) up, a Wave (2) correction, then a strong Wave (3) push to the highs. Now it's in Wave (4), a corrective structure labeled A-B-C on the chart.
Price hit the 0.382 retracement at 100.877 and pulled back toward the 0.5 retracement at 100.592. Both are classic zones for a fourth wave to find support before the next impulse. The drawn projection points toward Wave (5) well above 102.000, which is the move that would pressure gold if it plays out.
What invalidates the bullish DXY count
100.558 is the number that matters. Break it, and the whole board flips, the Wave (4) count is done and the bullish case for a Wave (5) rally falls apart.
Hold it, and don't be surprised if gold starts losing steam even without a clean reversal pattern of its own. That's the asymmetry here: DXY holding is a headwind for XAUUSD regardless of what gold's chart looks like on its own.
What this means for XAUUSD traders
Watch 100.558 on DXY like your life depends on it. This single level on the Dollar Index chart is doing more work for gold's outlook right now than anything printed on the XAUUSD chart itself.
A DXY holding above invalidation and grinding into Wave (5) is a different environment for gold than a DXY that breaks down. Traders looking at XAUUSD in isolation are missing half the picture.
The correlation doesn't guarantee a specific gold pattern, it sets the backdrop. Wave (4) holding on DXY is the backdrop that favors dollar strength and gold weakness until proven otherwise.
Key Takeaways
- •DXY completed Wave (3) and is now in a Wave (4) correction holding above the 0.5 retracement at 100.592.
- •Invalidation for the DXY bullish count sits at 100.558, the level that determines whether Wave (5) is still in play.
- •A DXY Wave (5) rally would create headwinds for XAUUSD even without a bearish reversal pattern on gold's own chart.
- •XAUUSD's near term direction is tied to the DXY correlation more than to gold's individual wave structure right now.
- •Traders watching XAUUSD should track 100.558 on DXY as the level that flips the broader dollar and gold relationship.
Frequently Asked Questions
What invalidates the bullish DXY Wave (4) count?
A break below 100.558 invalidates the current Wave (4) structure on DXY, which would undermine the case for a Wave (5) rally and change the outlook for gold.
Why does DXY affect XAUUSD if gold has its own chart pattern?
Gold and the dollar are inversely correlated, so a strong DXY impulse higher can pressure XAUUSD even when gold's own chart doesn't show a clean bearish pattern.
What is the current DXY Elliott Wave count?
DXY completed Wave (3) at the highs and is now in a corrective Wave (4), having retraced to the 0.382 level at 100.877 and holding above the 0.5 level at 100.592.
Disclaimer: This analysis is for educational purposes only and does not constitute financial advice. Elliott Wave analysis involves subjective interpretation. Always do your own research and manage your risk accordingly.
Get Full Coverage for All 27 Instruments
Premium members receive daily wave counts with entry zones, targets and invalidation levels, published daily across all 27 instruments.
View Premium Plans