BTCUSDT Elliott Wave: Triangle Rally Ends Near $79,800
The green path played out perfectly. A solid trading plan beats guessing every time.
Guessing feels like trading. Planning actually is trading.
The difference between the two isn't just profit. It's peace of mind. When you have a plan, you sleep well regardless of what Bitcoin does overnight. When you trade your feelings, every candle is a heart attack.
That's not a mindset quote tacked onto a chart. It's the whole point of mapping BTCUSDT the way this chart maps it. Plan the trade. Trade the plan. Let the market do the work.
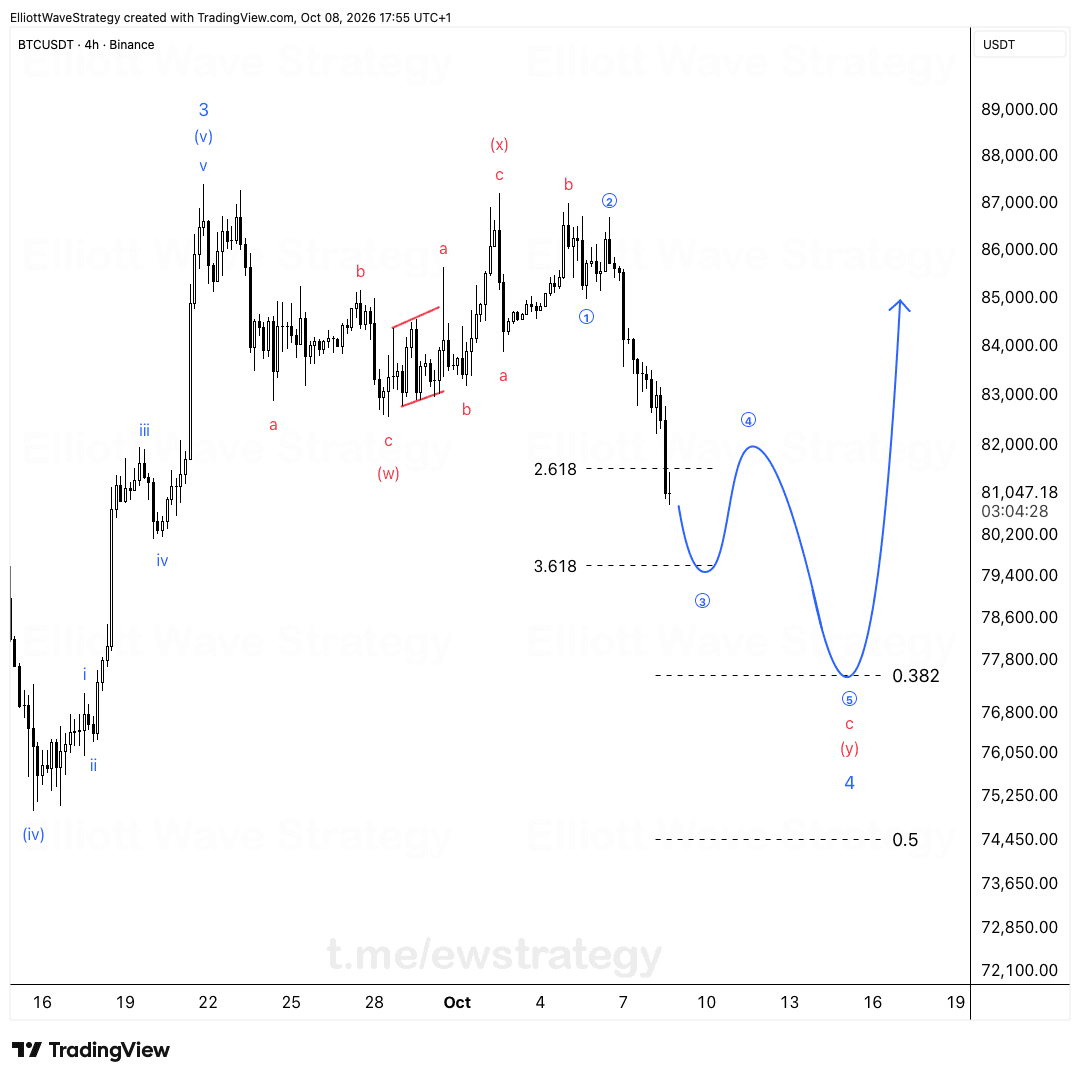
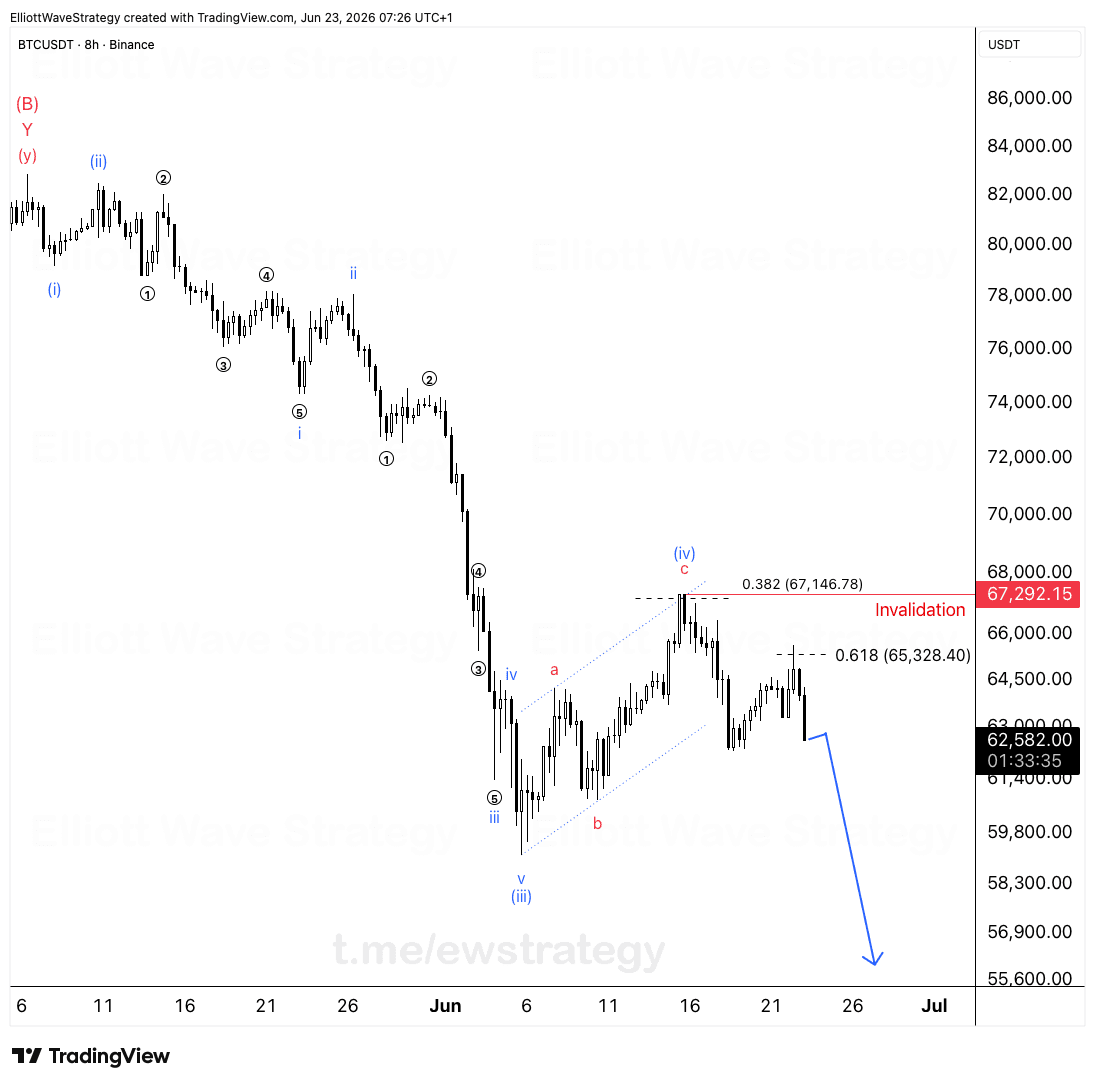
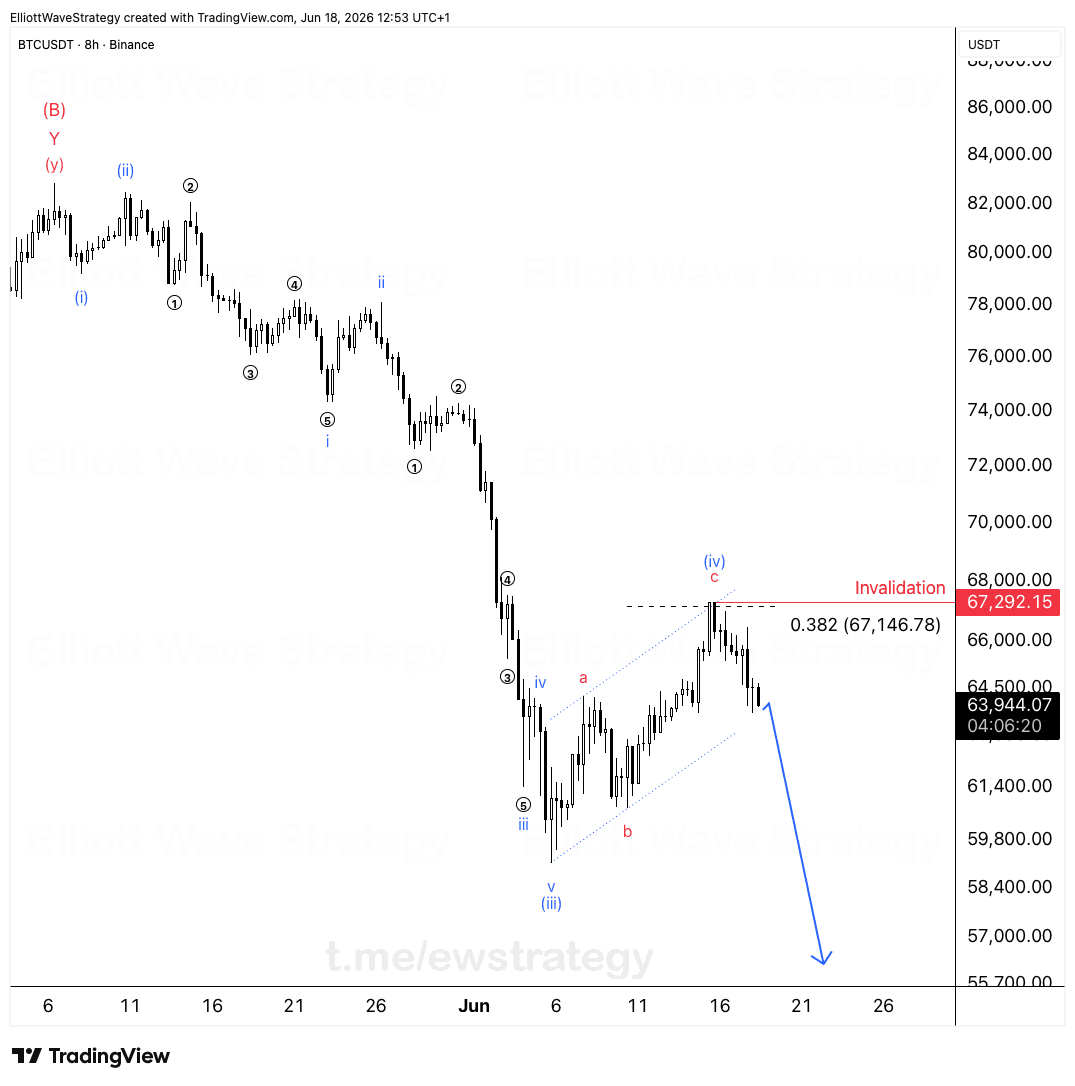
What does the BTCUSDT Elliott Wave count show right now?
The structure on the 4h chart traces back to a low near $59,150, labeled wave (iii) of a larger blue sequence. From there price built a corrective wave (iv), and that correction is where all the current action sits.
Wave (iv) itself is a double three. The first leg down, wave W, bottomed near $62,600 as a zigzag labeled A, B, C. Wave X connected it to wave Y, a second zigzag that topped near $76,000 at a point marked (Y).
From that (Y) top, the market didn't reverse hard. It carved a contracting triangle instead: wave A down, wave B up, wave C down, wave D up, wave E down. Triangles like this almost always show up in a wave that isn't final, which fits wave (iv) being the second to last piece of a larger pattern.
Why does the triangle breakout matter here?
Out of that wave E low, price launched into a new advance labeled (A), (B), (C) in black, and this leg is what pushed BTCUSDT up toward $79,800, right at the upper boundary of the long-running channel drawn from the $59,150 low through the (Y) high.
That channel top is exactly where the chart marks the label iv, top right. The rally has reached the resistance line of the broader ascending structure that has contained price since early February. A triangle resolving into a fifth wave that stalls at trendline resistance is a normal, expected outcome, not a surprise.
The arrow drawn on the chart projects a sharp reversal from this zone, back down toward the $65,000 to $66,500 area. That's the move the wave count implies once wave (iv) finishes: a turn down that would represent the start of wave (v) of the larger blue sequence, or the next leg of whatever larger degree move follows the current top.
How should a trader read this without overreacting to every candle?
This is exactly the scenario where a plan beats a feeling. The structure gives a location, resistance at the channel top near $79,800 to $80,000, and a level that would need to break to keep the fifth wave alive rather than reverse.
Traders who chase every 4h candle around this zone will get chopped up by the noise inside wave (C) and the triangle that preceded it. Traders who mapped wave (iv) in advance already know where the reaction should happen and what it should look like if the count is right.
The market doing the work means letting the structure confirm or invalidate itself instead of forcing an opinion on every wick.
Where this BTCUSDT structure leaves traders now
BTCUSDT sits at the top of its channel after completing a textbook double three correction in wave (iv), triangle included. The projected path points lower, back toward the $65,000 to $66,500 zone, but that projection only holds if resistance near $79,800 continues to cap price.
A plan doesn't guarantee the outcome. It just means the reaction, whichever way it goes, won't be a surprise.
Key Takeaways
- •BTCUSDT completed a wave (iv) double three correction that included a contracting triangle before pushing to $79,800.
- •The BTCUSDT rally into $79,800 hit the upper boundary of the channel drawn from the $59,150 low through the (Y) high.
- •A drawn projection on the BTCUSDT chart points toward a reversal back to the $65,000 to $66,500 zone.
- •The triangle structure inside wave (iv) is a normal pattern that typically precedes a final impulsive leg, not a random shape.
- •Trading BTCUSDT off a mapped structure removes the guesswork that turns every 4h candle into a reaction rather than a decision.
Frequently Asked Questions
What Elliott Wave pattern is BTCUSDT forming right now?
BTCUSDT completed a wave (iv) double three correction, made up of a zigzag (W), a connector (X), a second zigzag (Y), and a contracting triangle, before pushing into a fresh advance toward $79,800.
What would invalidate the bearish BTCUSDT projection from the chart?
The chart projects a reversal from the $79,800 to $80,000 channel resistance zone down toward $65,000 to $66,500. A sustained push above that resistance without a meaningful pullback would undermine the idea that wave (iv) has topped.
Why does the triangle in wave (iv) matter for the next BTCUSDT move?
Triangles typically appear in the wave position just before the final leg of a larger pattern, which is why the move out of the triangle low near $71,000 into $79,800 fits as the last leg of wave (iv) rather than a new trend.
Disclaimer: This analysis is for educational purposes only and does not constitute financial advice. Elliott Wave analysis involves subjective interpretation. Always do your own research and manage your risk accordingly.
Get Full Coverage for All 27 Instruments
Premium members receive daily wave counts with entry zones, targets and invalidation levels, published daily across all 27 instruments.
View Premium Plans