BTCUSDT: Is This Bounce Wave 2 or a New Bull Cycle?
The Question Everyone Is Asking: Is Bitcoin starting a real reversal, or is this just a Wave 2 correction?
Bitcoin bounced. Green candles are back on the screen, and everyone is asking the same question: is this a real reversal, or just Wave 2 doing what Wave 2 does?
We don't guess. We follow the structure.
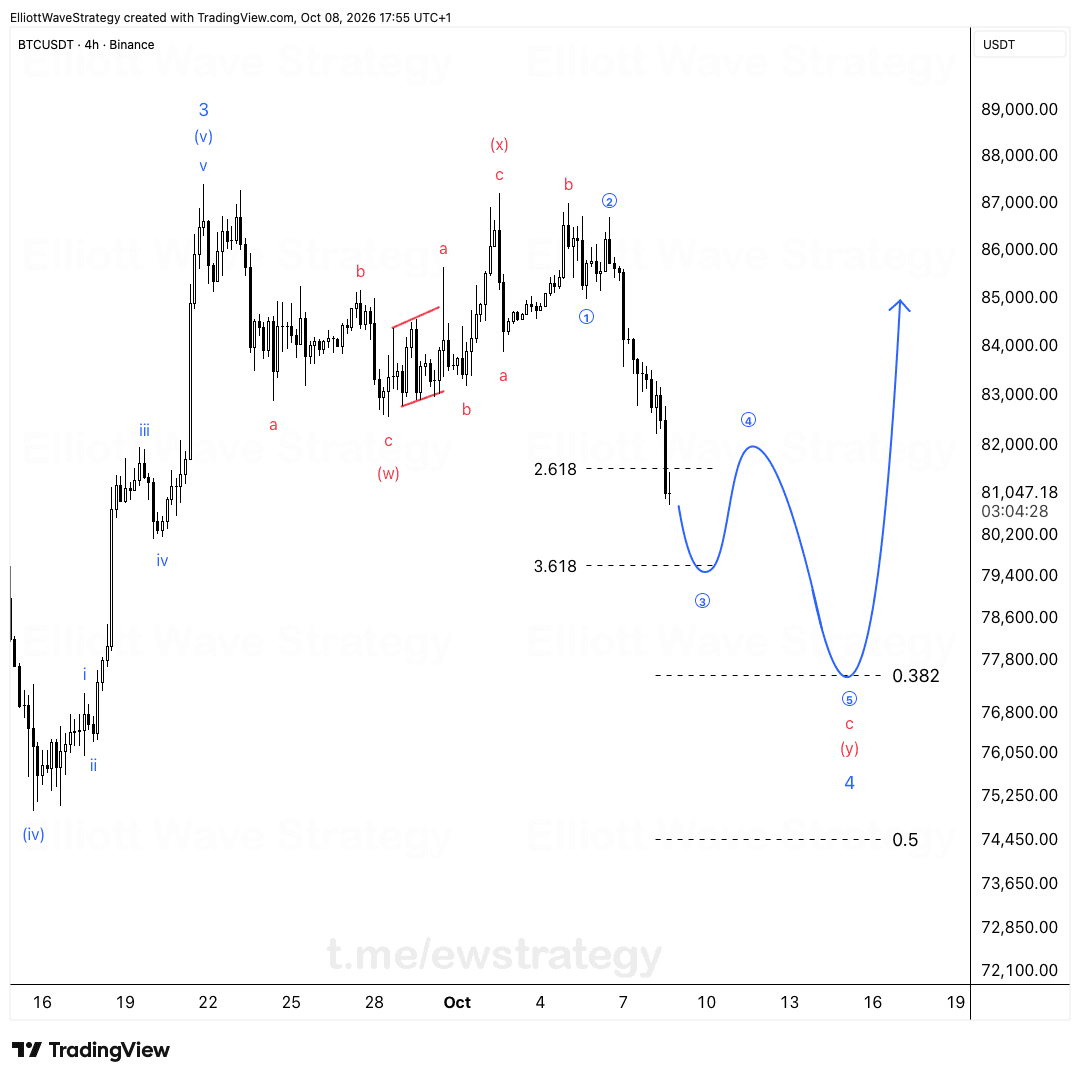
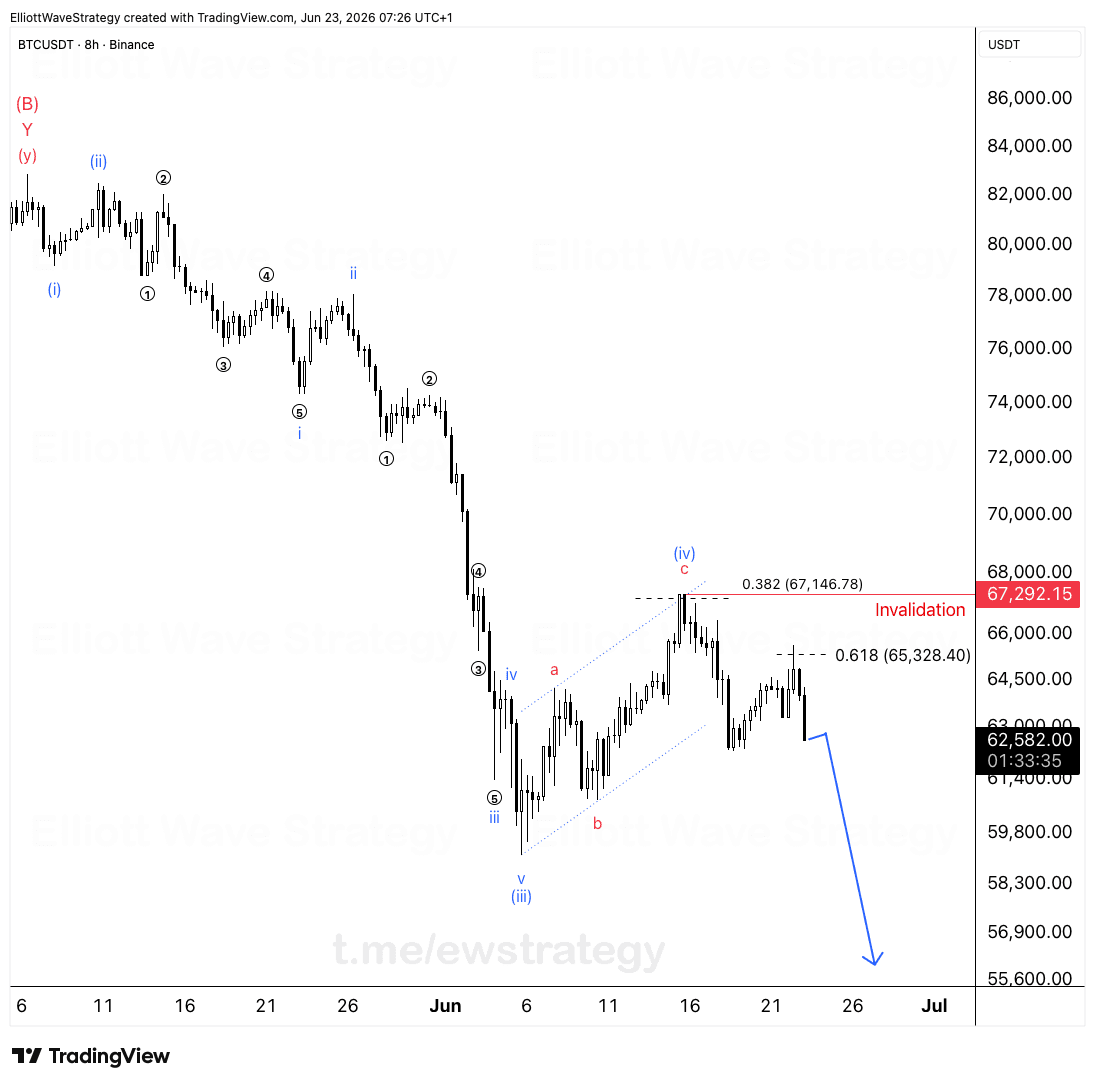
BTCUSDT can still push higher in the short term. The 4h chart shows a five wave decline into the recent low, labeled (v) of 1, and the bounce off that low is what we are now watching unfold as wave 2. The area between 77,600 and 78,900 is where the 0.5 and 0.618 retracement levels sit, and that is the zone to watch for this corrective leg.
But zoom out. On the Daily chart, the bigger structure still isn't clearly bullish. This is the part most traders skip past.
Why do traders mistake Wave 2 for a trend reversal?
Amateur traders see three or four green candles and assume the bottom is in. They stop analyzing and start hoping.
Professional traders see the exact same candles and ask a different question: is this Wave 2 of the decline that's still in progress, or Wave 1 of a genuinely new cycle? Those two scenarios look almost identical in real time. The only way to tell them apart is structure, not feeling.
That's the trap. A corrective bounce inside a larger downtrend can rally hard enough to convince anyone it's the start of something new. It isn't, until the market proves it.
What does the BTCUSDT structure actually show?
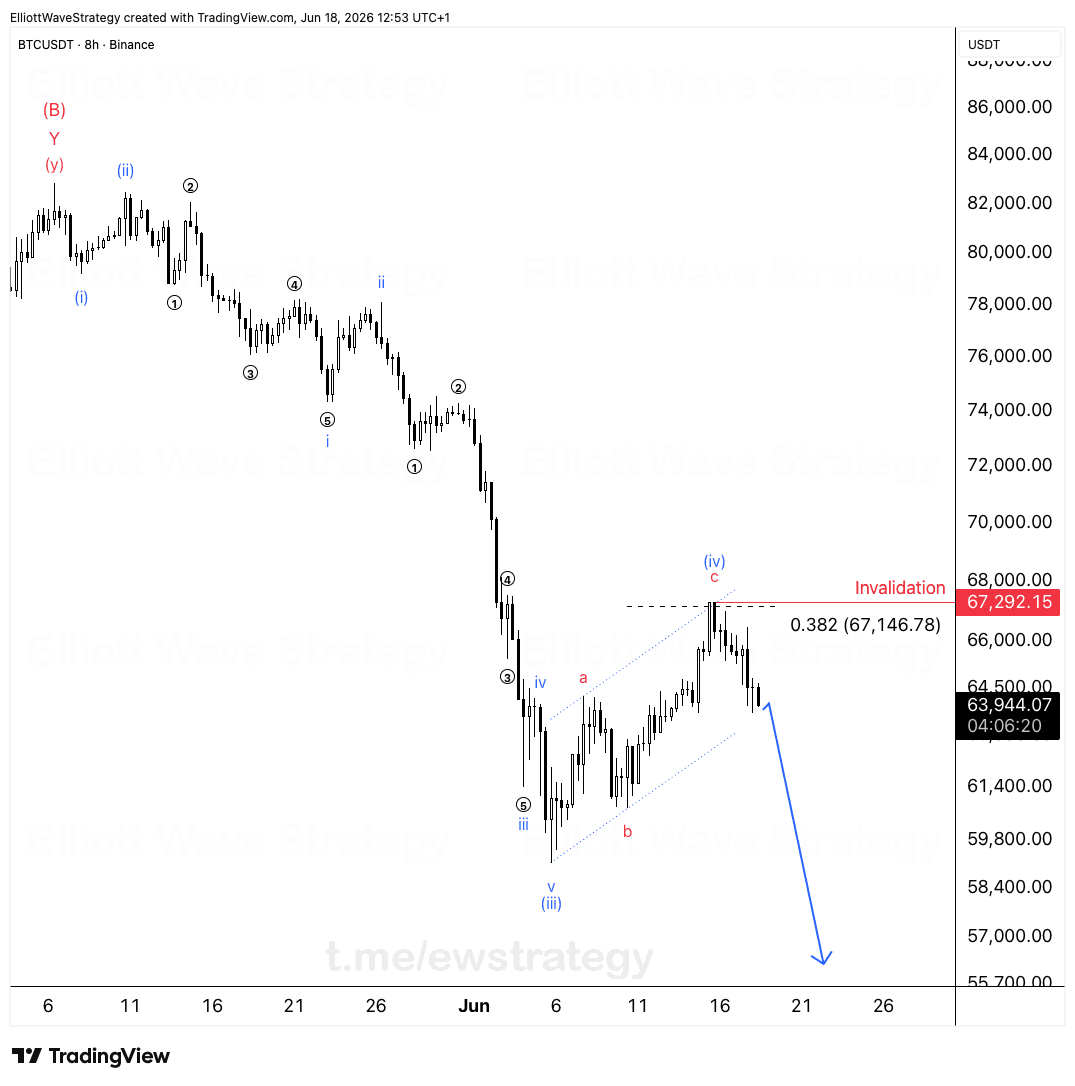
The 4h chart labels a clean five wave impulse down: (i) through (v), with wave (iii) extended and wave (iv) forming a clear pause before the final leg into (v) of 1. That's a textbook-free way of saying the decline had internal structure, not just random selling.
The current move up from that low is corrective in character. It doesn't have the sharp, impulsive look of the down legs that preceded it. That's the tell. Corrective bounces retrace a portion of the prior move and then struggle, which is exactly why the 77.6K to 78.9K zone matters as a retracement target rather than a breakout level.
Above that, the chart also carries an alternate count in red: a larger (4) wave labeled Y, (y), sitting up near the 82,850 region from earlier in May. That level isn't decoration.
What invalidates the bearish BTCUSDT structure?
Until BTCUSDT breaks above 82,850, the bearish scenario remains valid. That's the invalidation point, plotted directly on the chart as the red line.
A break and close above it would mean the decline from that (y) high wasn't a clean five wave move down, and the entire bearish structure needs to be reassessed. Below it, the current bounce is treated as corrective until proven otherwise.
This is the whole point of trading with an invalidation level. It removes the guesswork. The market either holds below 82,850, confirming the corrective bounce idea, or it breaks above and forces a rethink. No opinion needed either way.
The bottom line
Don't trade your emotions. Trade the plan.
The structure says this bounce is corrective, the 77.6K to 78.9K zone is the area to watch, and 82,850 is the line that changes everything. The market will tell us which scenario is correct. Our job is to listen to the chart, not the candle colors.
Key Takeaways
- •BTCUSDT's bounce off the recent low looks corrective, not the start of a confirmed new uptrend.
- •The 77,600 to 78,900 zone lines up with the 0.5 and 0.618 retracements of the prior decline in BTCUSDT.
- •82,850 is the invalidation level for the bearish BTCUSDT structure; a break above changes the entire count.
- •Green candles alone don't confirm a reversal in BTCUSDT, the internal wave structure does.
- •The Daily chart structure for BTCUSDT still isn't clearly bullish despite the short-term bounce.
Frequently Asked Questions
Is BTCUSDT starting a new bull cycle or just correcting?
Based on the current wave structure, the bounce looks corrective, likely a Wave 2 pullback within a larger bearish structure, rather than the start of a new bull cycle. That view holds as long as price stays below 82,850.
What invalidates the bearish BTCUSDT Elliott Wave count?
A break above 82,850 invalidates the bearish scenario and would force a reassessment of the entire wave structure, since it would mean the prior decline wasn't a complete five wave move down.
Why does the 77.6K to 78.9K zone matter for BTCUSDT?
That zone contains the 0.5 and 0.618 Fibonacci retracement levels of the prior down move, making it the natural area to watch for the current corrective bounce to stall.
Disclaimer: This analysis is for educational purposes only and does not constitute financial advice. Elliott Wave analysis involves subjective interpretation. Always do your own research and manage your risk accordingly.
Get Full Coverage for All 27 Instruments
Premium members receive daily wave counts with entry zones, targets and invalidation levels, published daily across all 27 instruments.
View Premium Plans