DXY Elliott Wave: Wave (B) Top at 102.945?
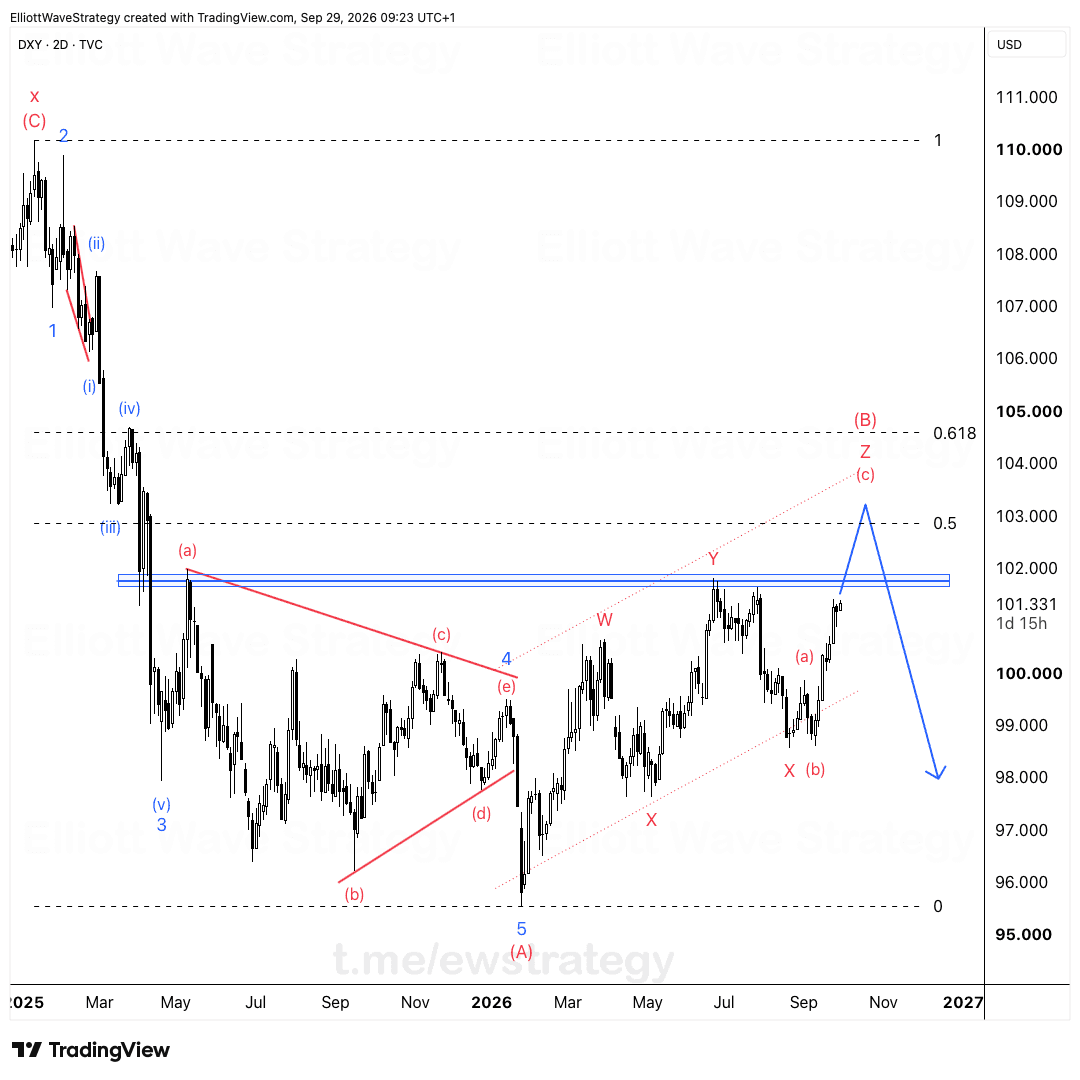
The dollar's rise since February looks like a correction to me. On the 2-day chart it's a W-X-Y-X-Z move that stopped at 102.945, right at the 50% retracement o
The dollar's rise since February looks like a correction to me. On the 2-day chart it's a W-X-Y-X-Z move that stopped at 102.945, right at the 50% retracement of last year's decline.
I marked that zone on October 7. Price touched the start of it and turned down hard.
Why is the DXY rally since February a correction?
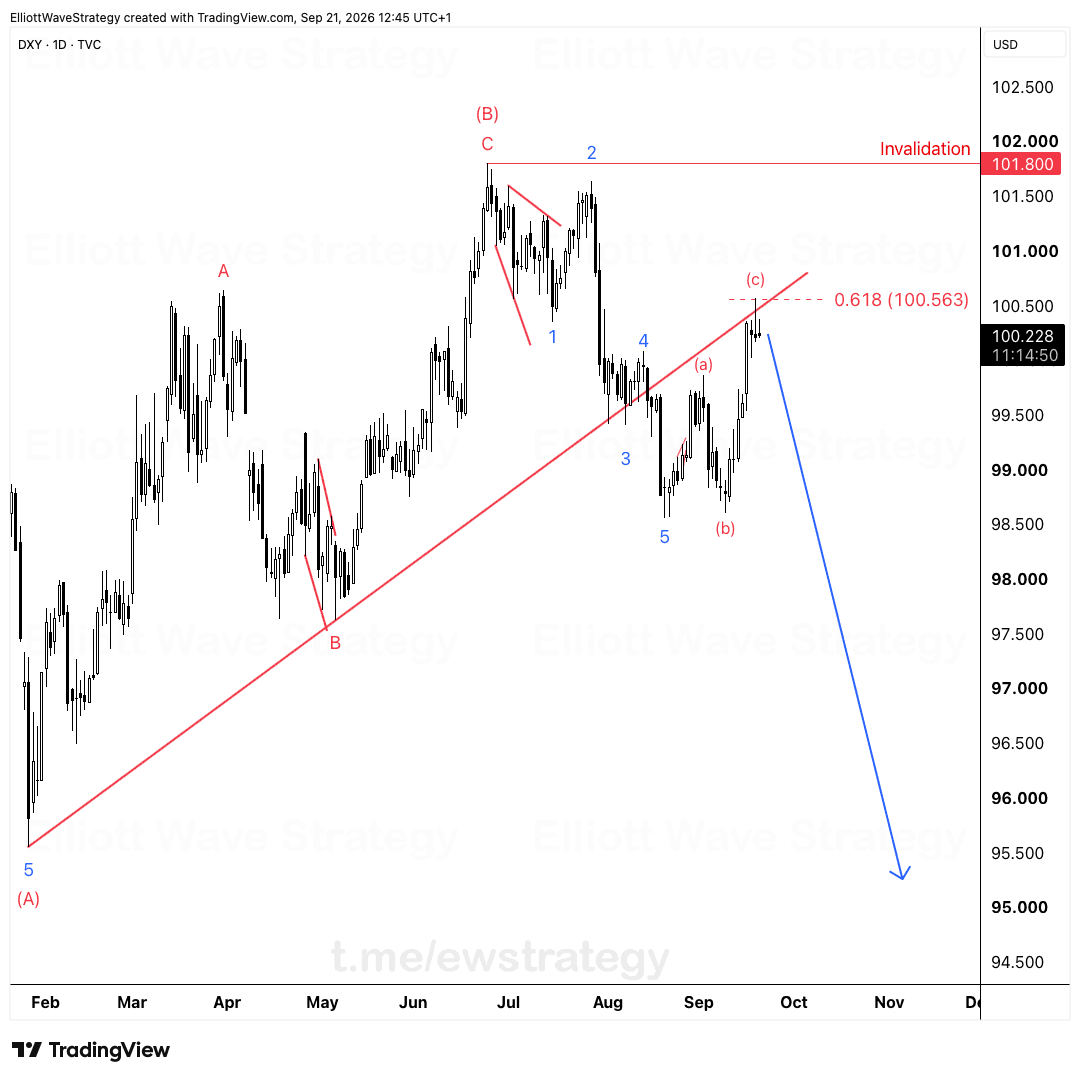
The decline from 110.176 is labeled (C), 1-2-3-4-5 and (A) on the chart, ending at 95.551. That is a complete five-wave structure down, followed by a rally that does not look like one.
The rally overlaps itself and moves inside a rising channel. It builds as W, X, Y, X, Z, a complex corrective combination. Impulses drive. This one grinds, retraces, and grinds again.
That is why I treat it as wave (B) and not the start of a new uptrend.
Where did the DXY correction stop, and why does 102.945 matter?
The high is 102.945. The 50% retracement of the full decline from 110.176 to 95.551 sits at 102.864. Price pushed through it by a few ticks and reversed.
The 0.618 retracement at 104.589 was never reached. A wave (B) that stalls at the half-way mark and turns sharply lower is what I want to see when a larger decline is still unfinished.
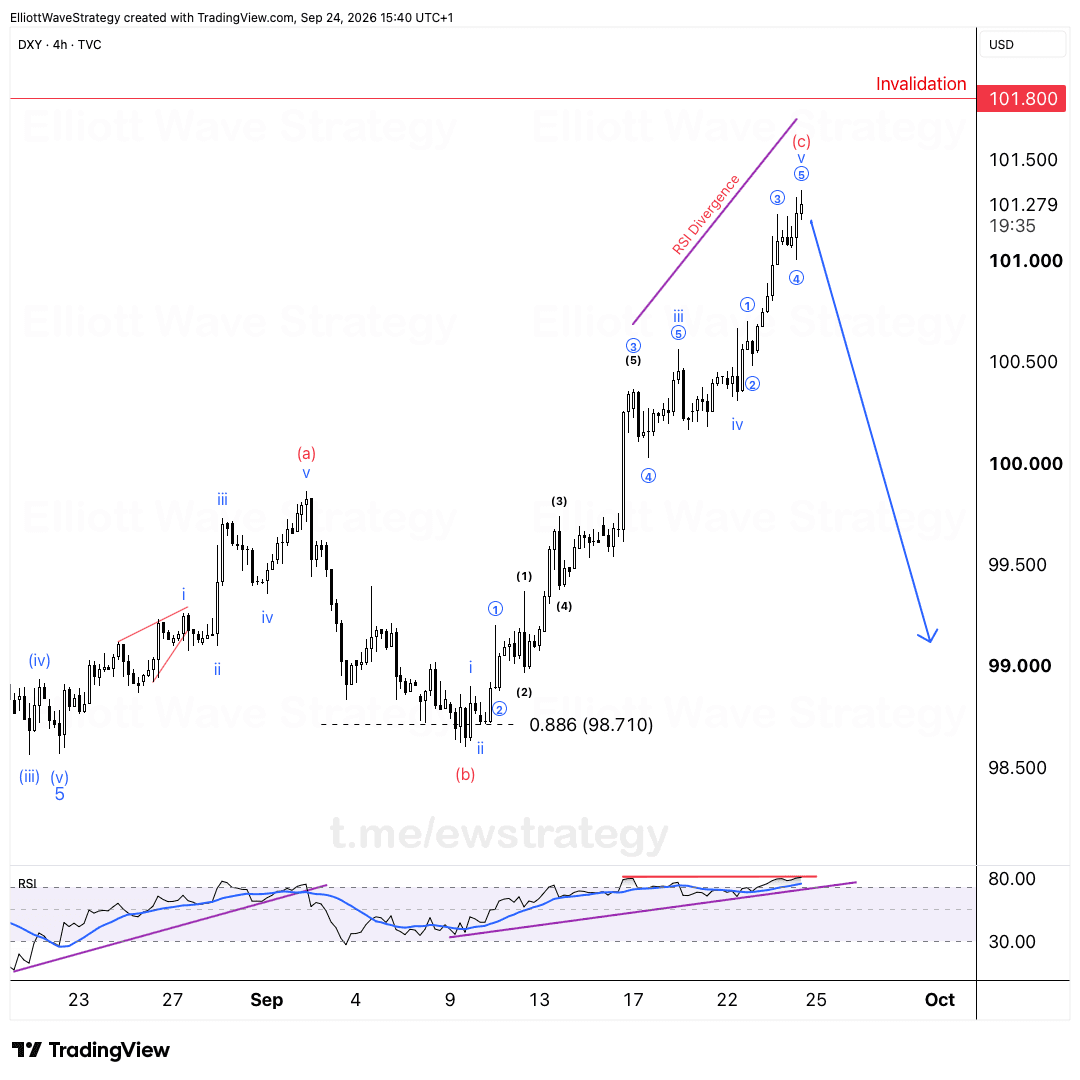
So 102.945 is the line in the sand. Above it, this count is off.
What is the DXY target if wave (C) is underway?
I count wave (B) as complete. Wave (C) should take the dollar back toward the February low near 95.551.
The arrow on the chart shows that path: a decline from the 102.945 area to the low 95s. Price currently trades near 101.779, so most of that move is still ahead.
What does a weaker dollar mean for forex pairs?
The dollar sits on one side of every major pair, so one count drives many charts. That is why EURUSD and GBPUSD turned last week.
All Premium charts are updated for the new week, and every dollar pair's plan starts from this one. If you trade dollar pairs without a view on DXY, you are guessing at the base layer.
The structure here is clear and the invalidation is a single price. Read the chart, not the headlines.
Key Takeaways
- •DXY's rally since February is counted as a W-X-Y-X-Z correction, not a new impulse higher.
- •The DXY wave (B) high at 102.945 sits right at the 50% retracement of the decline from 110.176 to 95.551.
- •The DXY Elliott Wave count is invalidated by any move above 102.945.
- •If wave (C) is underway, DXY should head back toward the February low near 95.551.
- •A turn in DXY at 102.945 explains the simultaneous reversals in EURUSD and GBPUSD last week.
Frequently Asked Questions
What invalidates the bearish DXY Elliott Wave count?
A move above 102.945, the wave (B) high. That level is the single invalidation for the count that expects wave (C) lower.
What is the DXY target in wave (C)?
The count points back toward the February low near 95.551, which is the 0 level of the Fibonacci grid drawn from the 110.176 high.
Why does the 50% retracement matter for DXY?
The 50% retracement of last year's decline sits at 102.864. Price stalled just above it at 102.945 and turned down hard, which fits a completed wave (B) correction.
Disclaimer: This analysis is for educational purposes only and does not constitute financial advice. Elliott Wave analysis involves subjective interpretation. Always do your own research and manage your risk accordingly.
Get Full Coverage for All 27 Instruments
Premium members receive daily wave counts with entry zones, targets and invalidation levels, published daily across all 27 instruments.
View Premium Plans