GBPUSD Elliott Wave: Wave (5) Eyes 1.351-1.359 Zone
Small losses keep you in the game long enough to see big wins. This separates professional traders from those who blow accounts.
Small losses keep you in the game long enough to see big wins. That single idea separates professional traders from those who blow accounts, and it applies directly to what GBPUSD is doing right now.
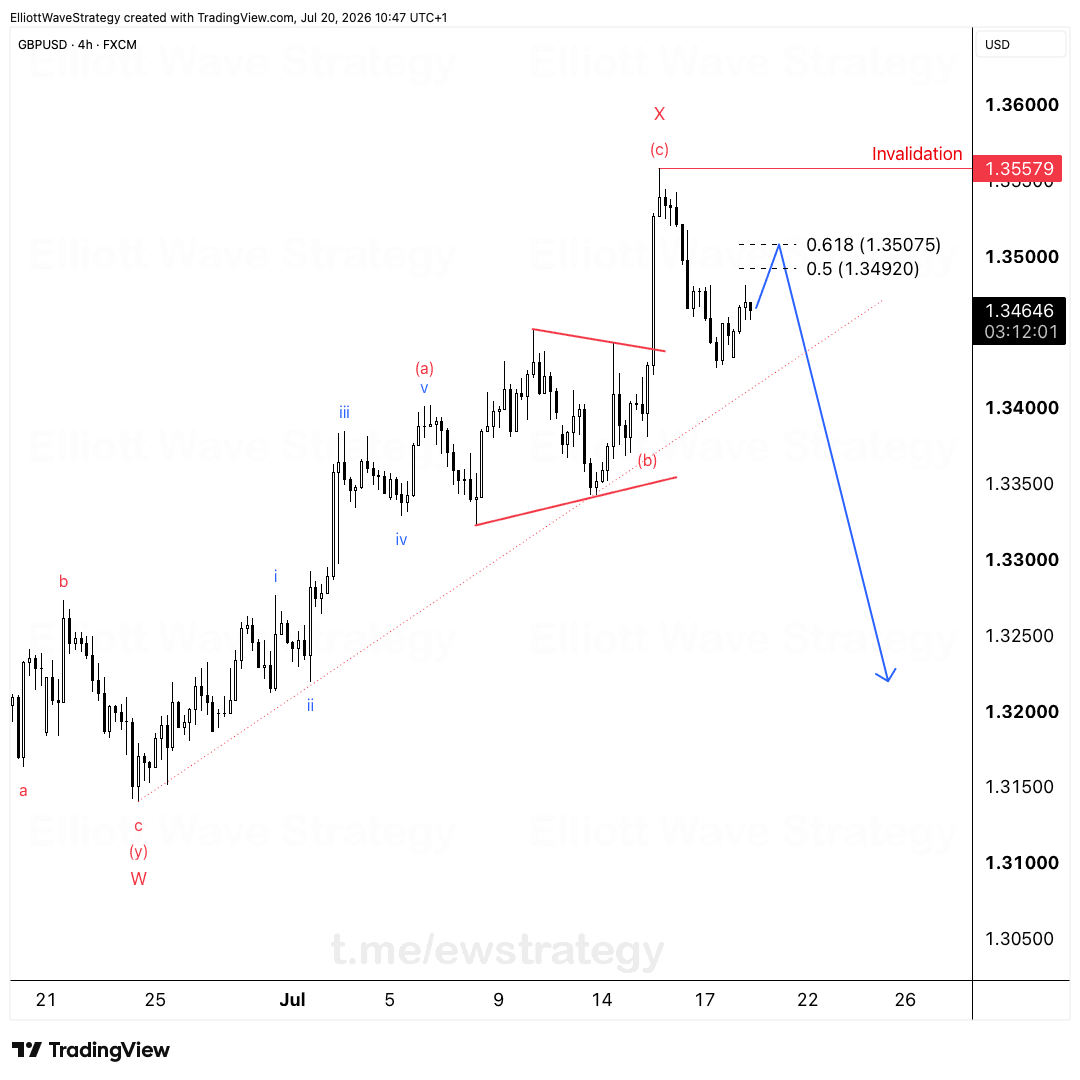
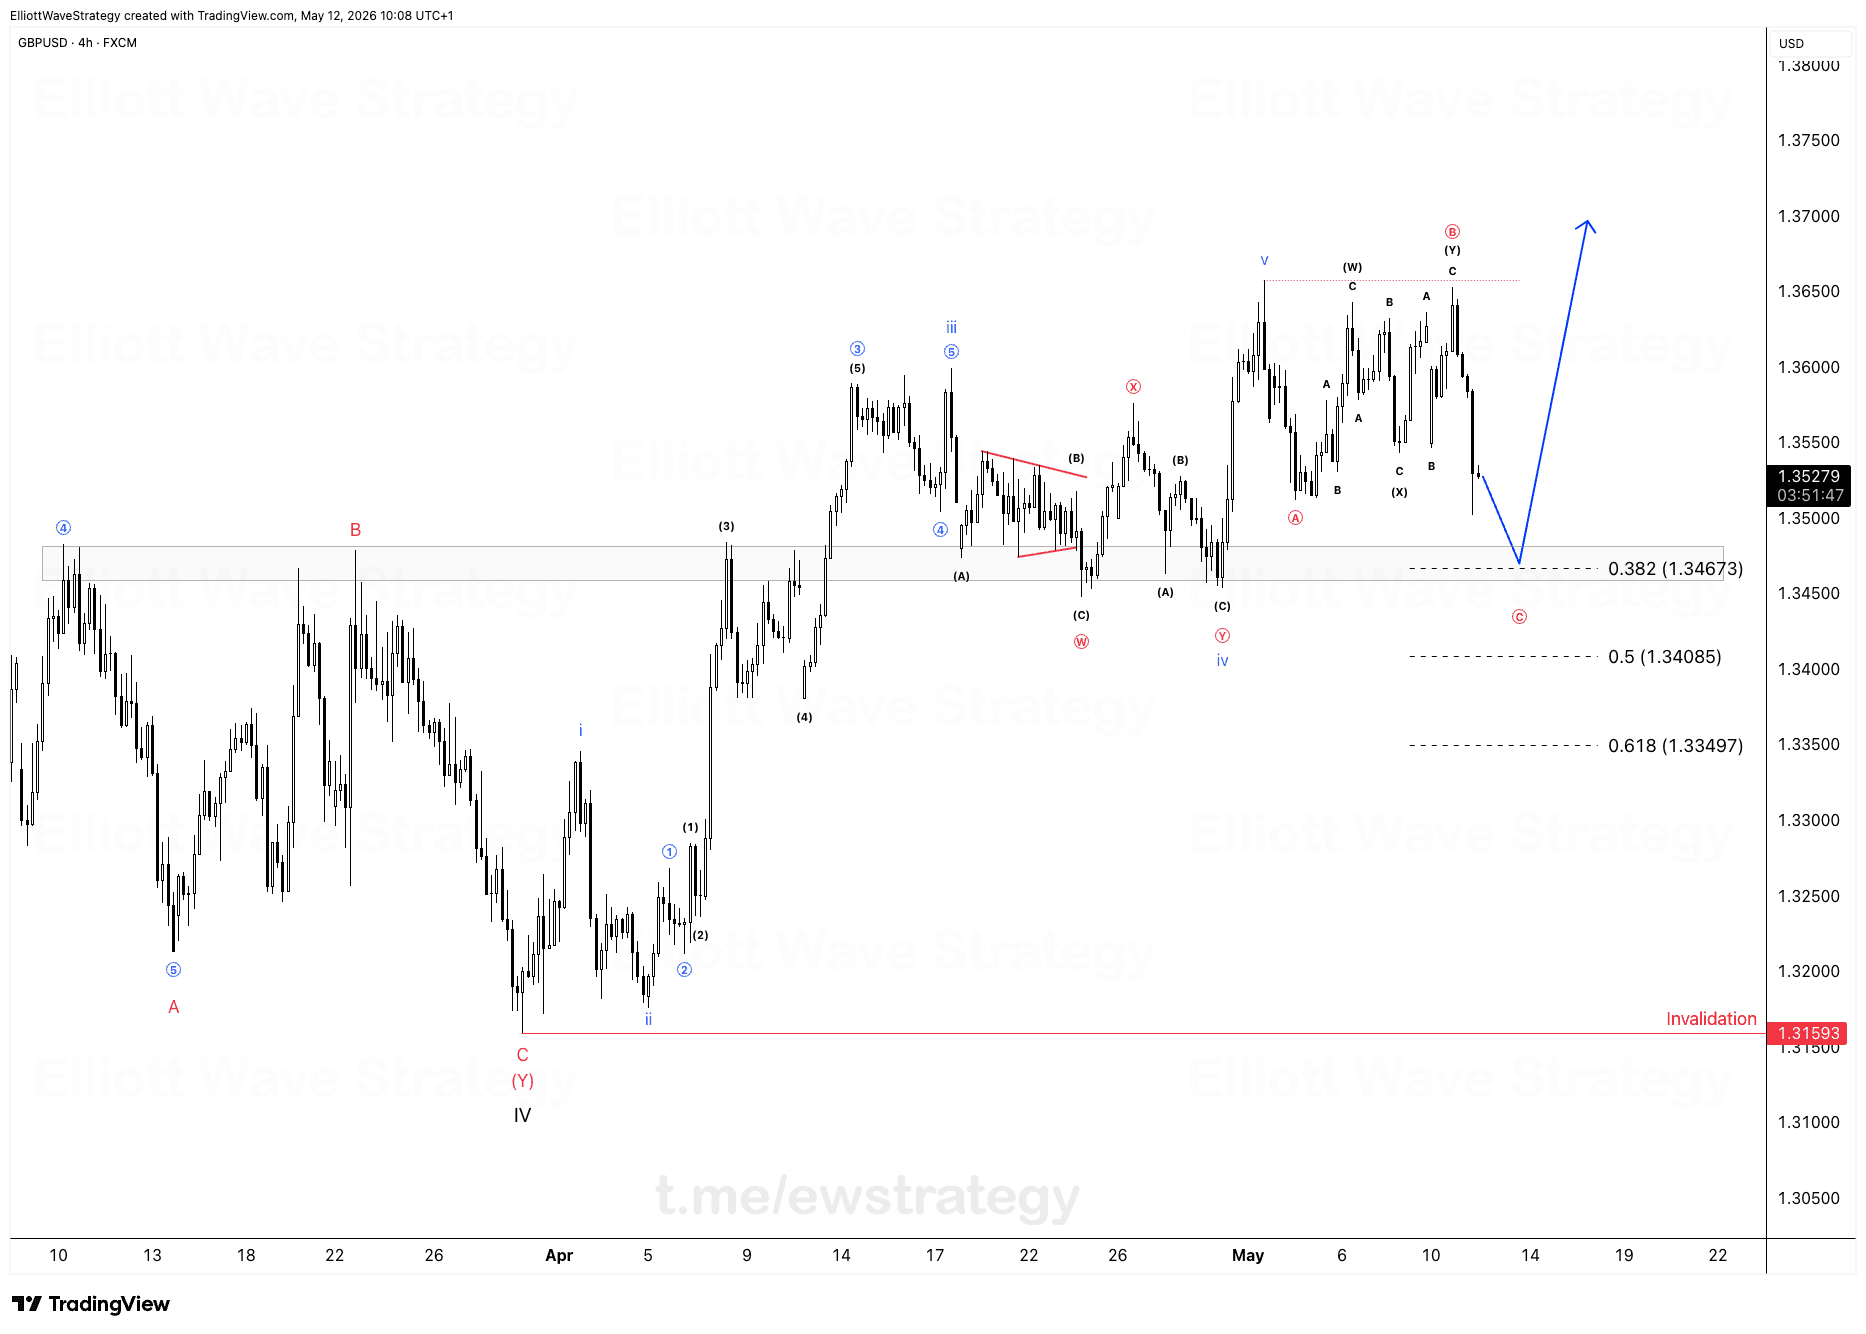
We have been tracking this correction for weeks. The chart shows a five wave decline from the (5) top near 1.400 down through waves 1 through 5 of a blue wave impulse, followed by a corrective sequence in wave (X), (Y). That corrective sequence is now labeled with a red A, B, C, and price is sitting inside wave (3) of C, working through wave (4) before the final leg.
What GBPUSD needs to complete wave (5) of C
The structure needs one final push higher. That push targets the 0.5 to 0.618 Fibonacci retracement zone, between 1.35139 and 1.35976.
On the 4h chart, price has already built waves (1) through (4) of this final rally, with (4) forming just above 1.340. Wave (5) is the piece still missing. Once GBPUSD reaches that 1.351 to 1.359 zone, wave (5) of C completes the entire corrective structure that started at the (5) high.
After that zone is tagged, the drawn trajectory on the chart points sharply lower, back down toward the 1.330 area. That is the move that matters once this final rally finishes.
Why amateur traders struggle with this kind of setup
Amateur traders see this volatility and panic. They cut winners early and hold losers too long. They think every red candle means disaster.
A corrective structure like this A-B-C sequence chops back and forth for weeks. Anyone watching candle by candle without a wave count gets shaken out repeatedly. The people who stay in the game are the ones who already know the structure needs a wave (5) push before anything changes.
How professional traders handle a setup like GBPUSD right now
We think differently. Stick to the plan. Risk max 1% per trade. Let the structure confirm before entering. Accept small losses as business costs.
One high-RRR setup like this can recover 10 small stop losses. That is how professional trading works. GBPUSD reaching the 1.351 to 1.359 zone does not guarantee anything by itself, it is one data point inside a larger wave count that needs the reversal to actually confirm before it means what we think it means.
The wave (4) low near 1.340 matters here too. As long as that area holds while GBPUSD grinds toward the Fibonacci zone, the wave (5) count stays intact. A break below it would force a rethink of the entire C wave structure.
What this means going forward
GBPUSD is not done with its corrective rally yet. The 1.351 to 1.359 zone is the area to watch for wave (5) of C to complete, and what happens after price reaches that zone is where the real structural decision gets made.
Key Takeaways
- •GBPUSD is completing wave (5) of a corrective C wave, targeting the 0.5 to 0.618 Fibonacci zone between 1.35139 and 1.35976.
- •The wave (4) low near 1.340 needs to hold for the GBPUSD wave (5) count to remain valid.
- •Once GBPUSD reaches the 1.351-1.359 zone, the drawn Elliott Wave trajectory points toward a reversal back near 1.330.
- •Professional trading on GBPUSD setups like this relies on risking a small percentage per trade and letting structure confirm before acting.
- •Amateur traders often exit GBPUSD winners too early and hold losers too long because they react to individual candles instead of the wave structure.
Frequently Asked Questions
What is the GBPUSD Elliott Wave target for wave (5) of C?
The target zone is between 1.35139 and 1.35976, based on the 0.5 and 0.618 Fibonacci retracement levels marked on the chart.
What would invalidate the current GBPUSD wave (5) count?
A decisive break below the wave (4) low near 1.340 would undermine the idea that GBPUSD is still building a final wave (5) push higher.
What happens after GBPUSD completes wave (5) of C?
According to the drawn trajectory on the chart, once wave (5) of C completes in the 1.351-1.359 zone, price is expected to reverse and decline back toward the 1.330 area.
Disclaimer: This analysis is for educational purposes only and does not constitute financial advice. Elliott Wave analysis involves subjective interpretation. Always do your own research and manage your risk accordingly.
Get Full Coverage for All 27 Instruments
Premium members receive daily wave counts with entry zones, targets and invalidation levels, published daily across all 27 instruments.
View Premium Plans