US100 Elliott Wave: Wave Two Done, Wave Three Targets 30,399
Monday I labeled this pullback as wave two. Wednesday hit and Nasdaq dropped again, red candle after red candle. A lot of traders sold right at the low, sure th
Monday I labeled this pullback as wave two. Wednesday hit and Nasdaq dropped again, red candle after red candle. A lot of traders sold right at the low, sure the rally was done.
That is the usual mistake. A corrective low feels like the start of a crash, because it comes with the most fear and the least structure.
Is the US100 wave two correction finished?
My read: wave two is finished. The drop on Wednesday was a clean A-B-C, and it held above the invalidation at 26,871.9.
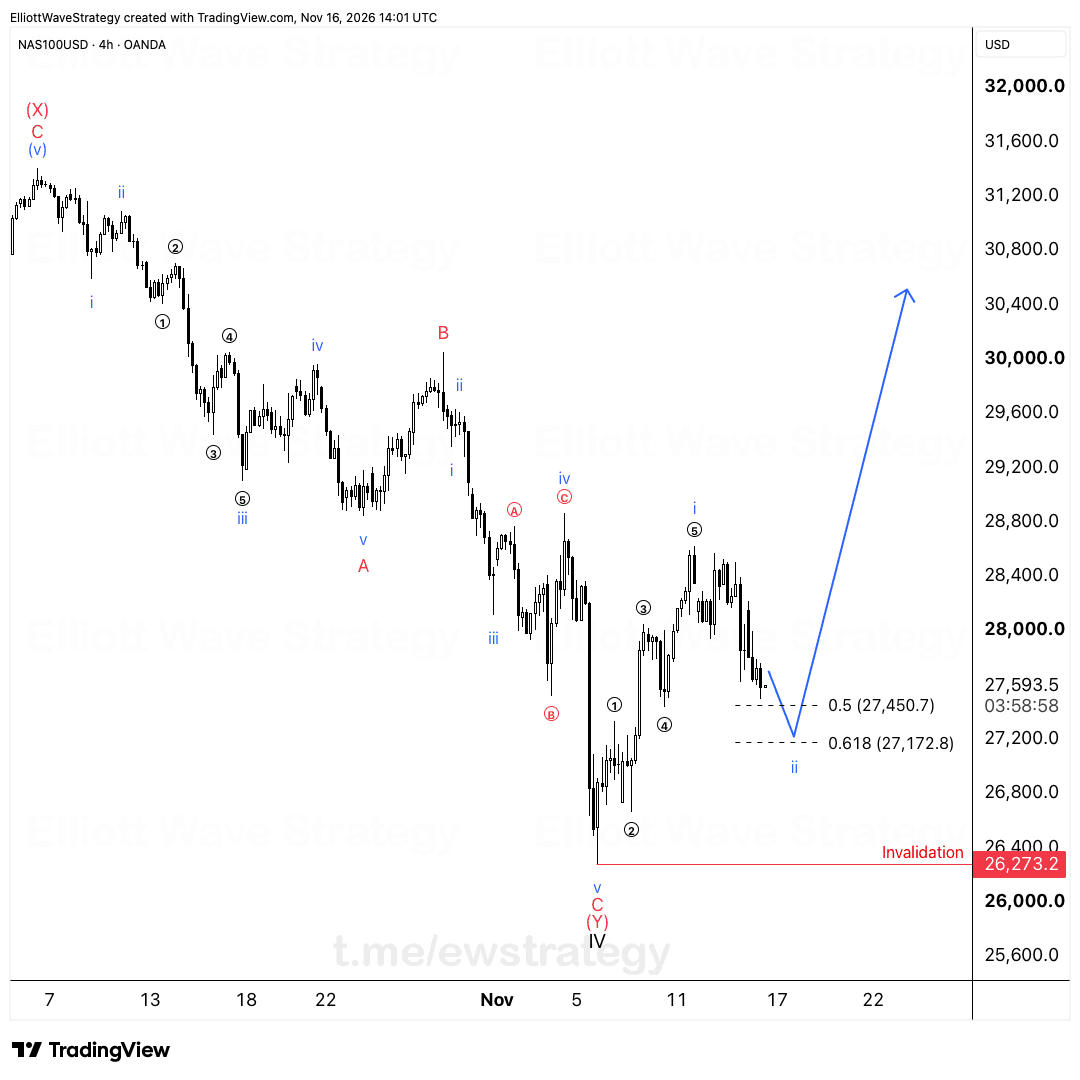
On the 4h chart, the decline is labeled as a three-wave move into the low, marked ii. A-B-C is what a correction looks like. It does not look like the opening leg of a fresh impulse down.
Since that low, price has turned up with a small first wave, marked (1), and a higher low at (2). The sequence that follows a finished correction is exactly this: a small impulse off the low, a shallow pullback, then acceleration.
Where does US100 go if wave three starts here?
I still want wave three from here. Wave three is usually the strongest leg of an impulse wave, and it is where traders who sold the low get punished.
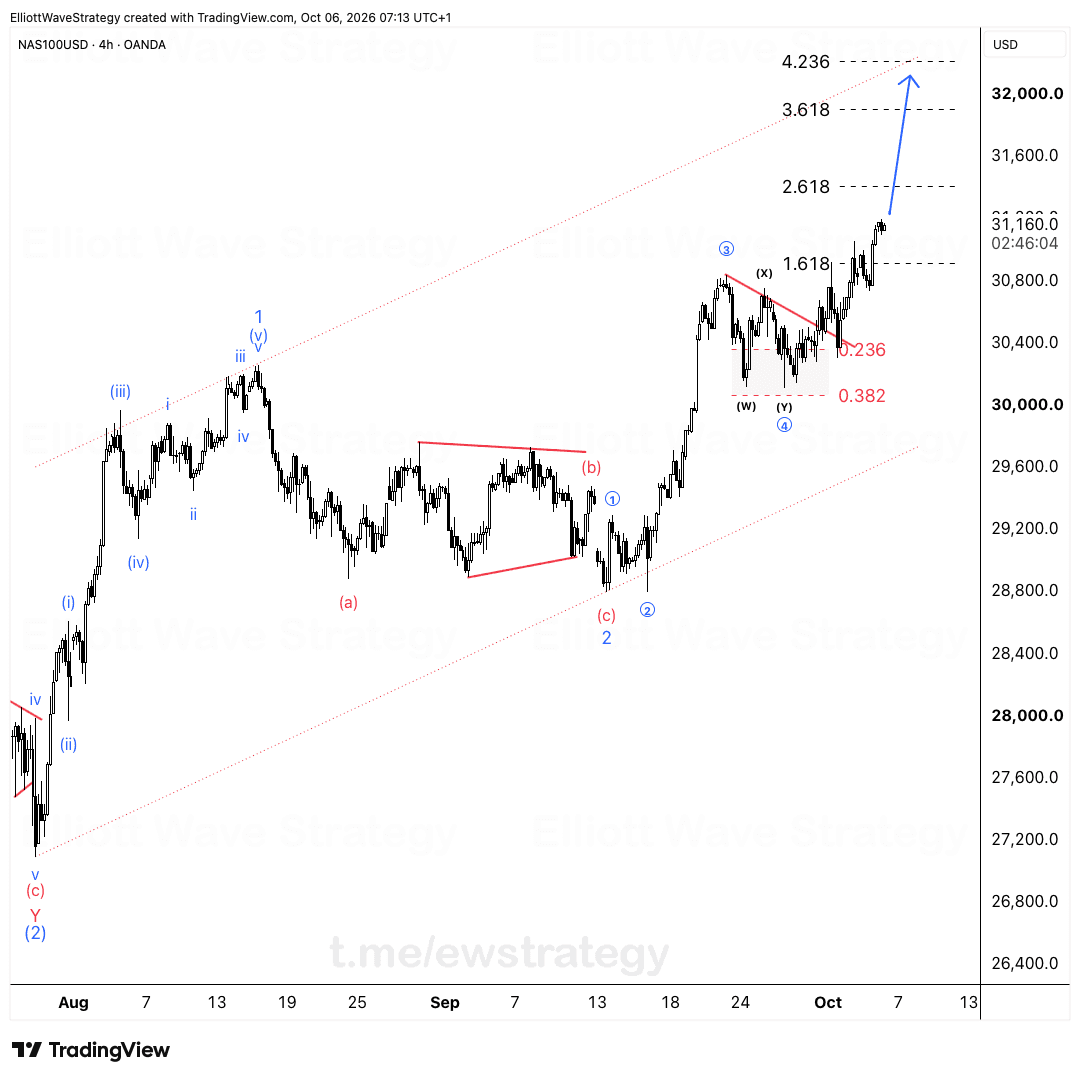
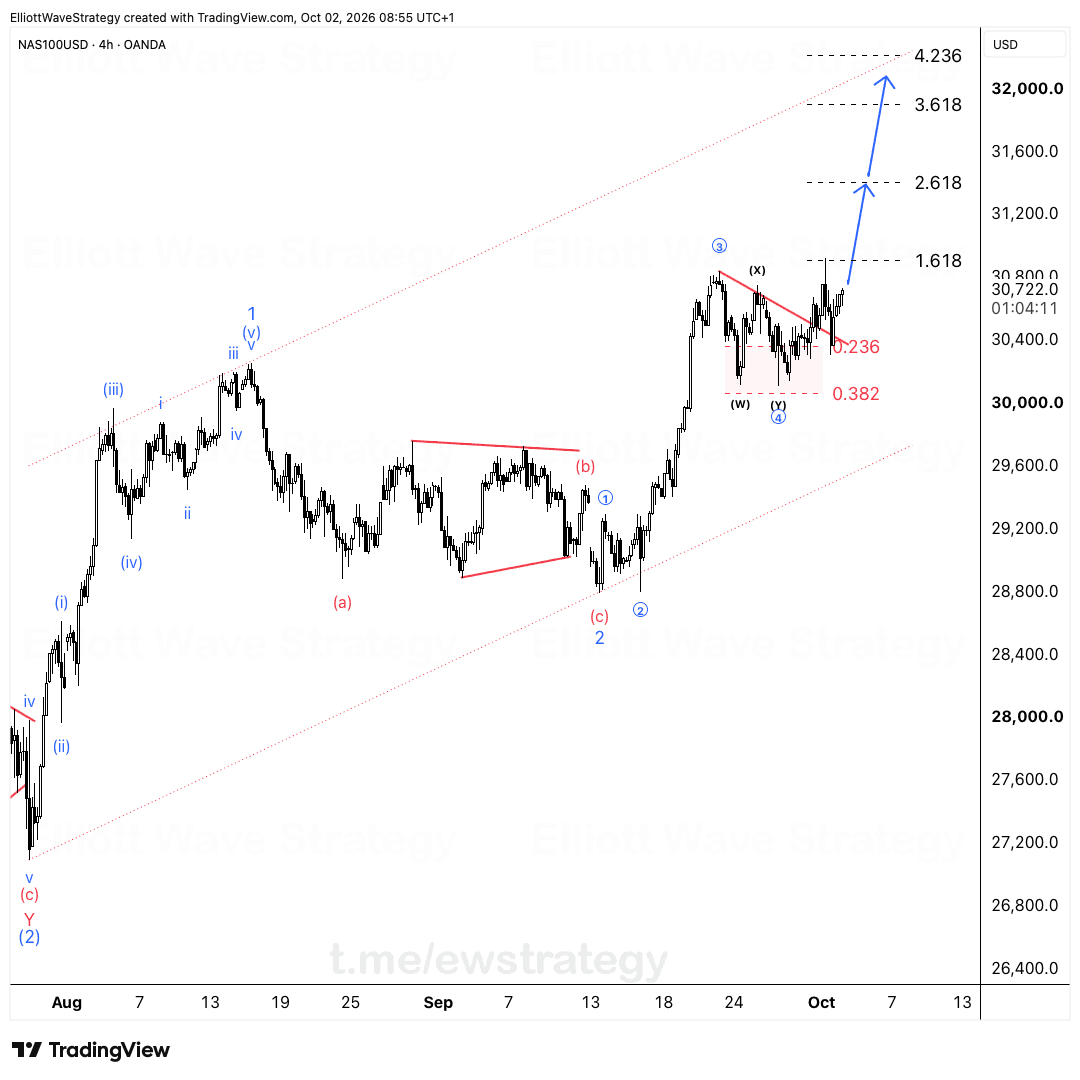
The first target is the 1.618 extension at 30,399. Above that sits the 2 extension at 31,294.4. The arrow on the chart shows the path I expect, a sharp advance through the 1 extension at 28,950.3 and on toward the upper targets.
These are projections from the wave structure. They are not promises, and price has to earn each one.
What invalidates the US100 count?
A close below 26,871.9 kills the count. That is the level where the wave two low would be broken, and a wave two that goes lower than its starting point is not a wave two.
If that happens, I rework it. No arguing with the chart, no hoping. The invalidation level exists so the count can be wrong without the analyst being stubborn about it.
Why do traders sell the low of a correction?
Because the low of wave two looks identical to the start of a bigger collapse. Red candles stack up, headlines turn negative, and the previous rally feels like a trap.
Elliott Wave gives you a way to separate the two. A three-wave drop that respects a defined level is a correction. A five-wave drop that breaks it is something else. Wednesday was the first one.
For the full theory behind impulses and corrections, see the Elliott Wave theory guide. For how I apply it to indices, see Elliott Wave for stocks and indices.
The count is simple: wave two done, wave three next, and one level that proves me wrong.
Key Takeaways
- •US100 completed a clean A-B-C decline into wave two and held above the 26,871.9 invalidation level.
- •The US100 Elliott Wave count calls for wave three from here, with the 1.618 extension at 30,399 as the first target.
- •A close below 26,871.9 invalidates the US100 wave two count and forces a rework.
- •Above 30,399, the next US100 target is the 2 extension at 31,294.4.
- •Selling the low of a wave two correction is a common mistake, because a three-wave drop that holds its level is corrective, not the start of a larger decline.
Frequently Asked Questions
What invalidates the bullish US100 Elliott Wave count?
A close below 26,871.9. That level protects the wave two low, and a break below it means the correction was not a wave two. If it breaks, the count gets reworked.
What are the Elliott Wave targets for US100 wave three?
The first target is the 1.618 extension at 30,399, with the 2 extension at 31,294.4 above it. The 1 extension at 28,950.3 sits on the way up.
Why is the US100 drop considered a wave two and not a bigger decline?
The decline was a clean A-B-C and held above 26,871.9. Since the low, price printed a small first wave and a higher low, which is the structure expected after a finished correction.
Disclaimer: This analysis is for educational purposes only and does not constitute financial advice. Elliott Wave analysis involves subjective interpretation. Always do your own research and manage your risk accordingly.
Get Full Coverage for All 27 Instruments
Premium members receive daily wave counts with entry zones, targets and invalidation levels, published daily across all 27 instruments.
View Premium Plans