USOIL Elliott Wave: Triangle Breaks, Wave C Drops to $80
The triangle did what triangles do. Six days, ten dollars lower!
The triangle did what triangles do. Six days, ten dollars lower.
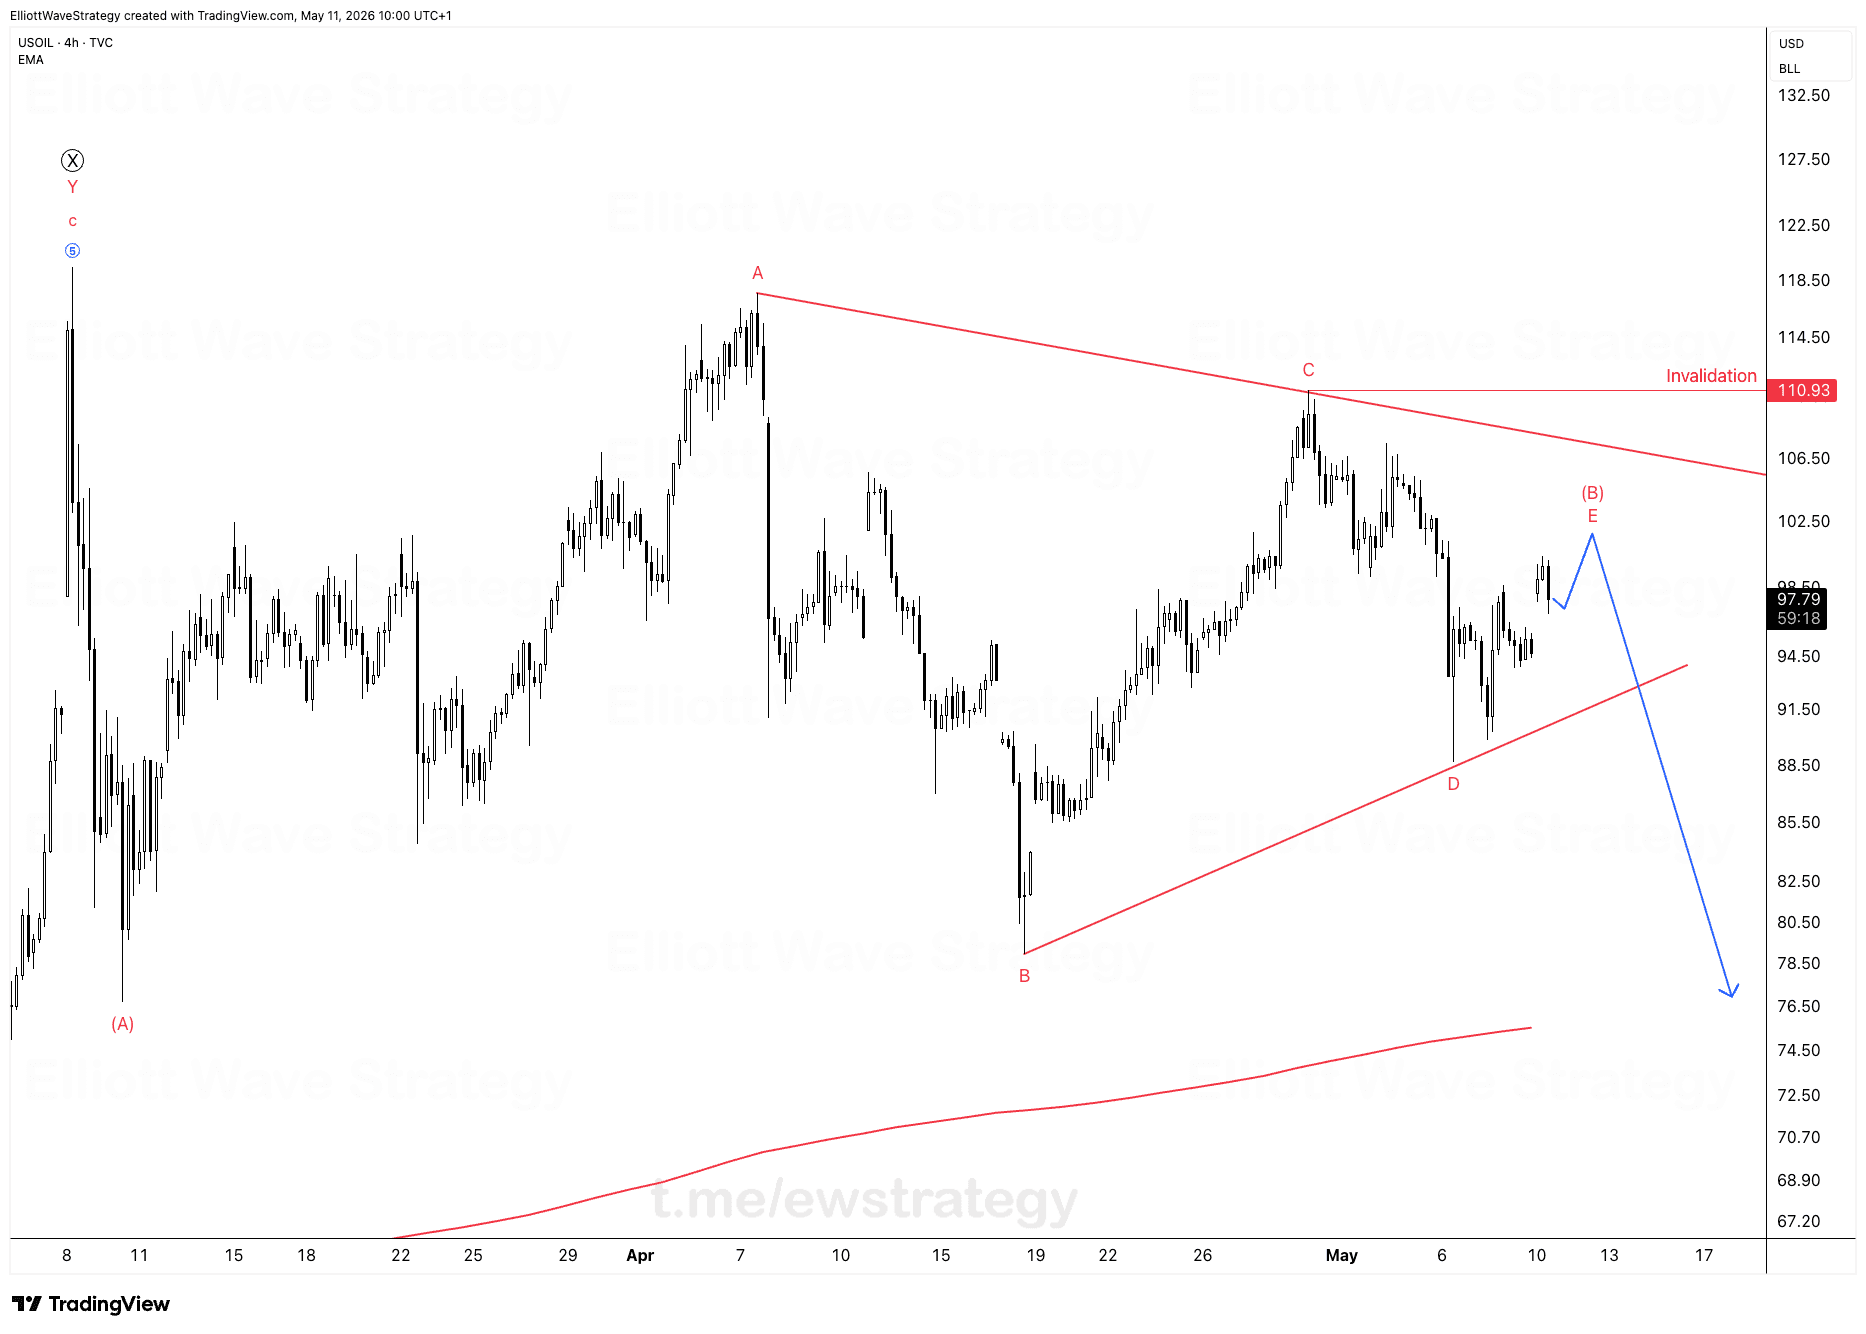
We spotted this pattern forming at 105.21 and called it out before the break. Triangles are coiling springs. They store energy sideways, then release it in a sharp thrust once the structure completes. That's exactly what USOIL just handed traders.
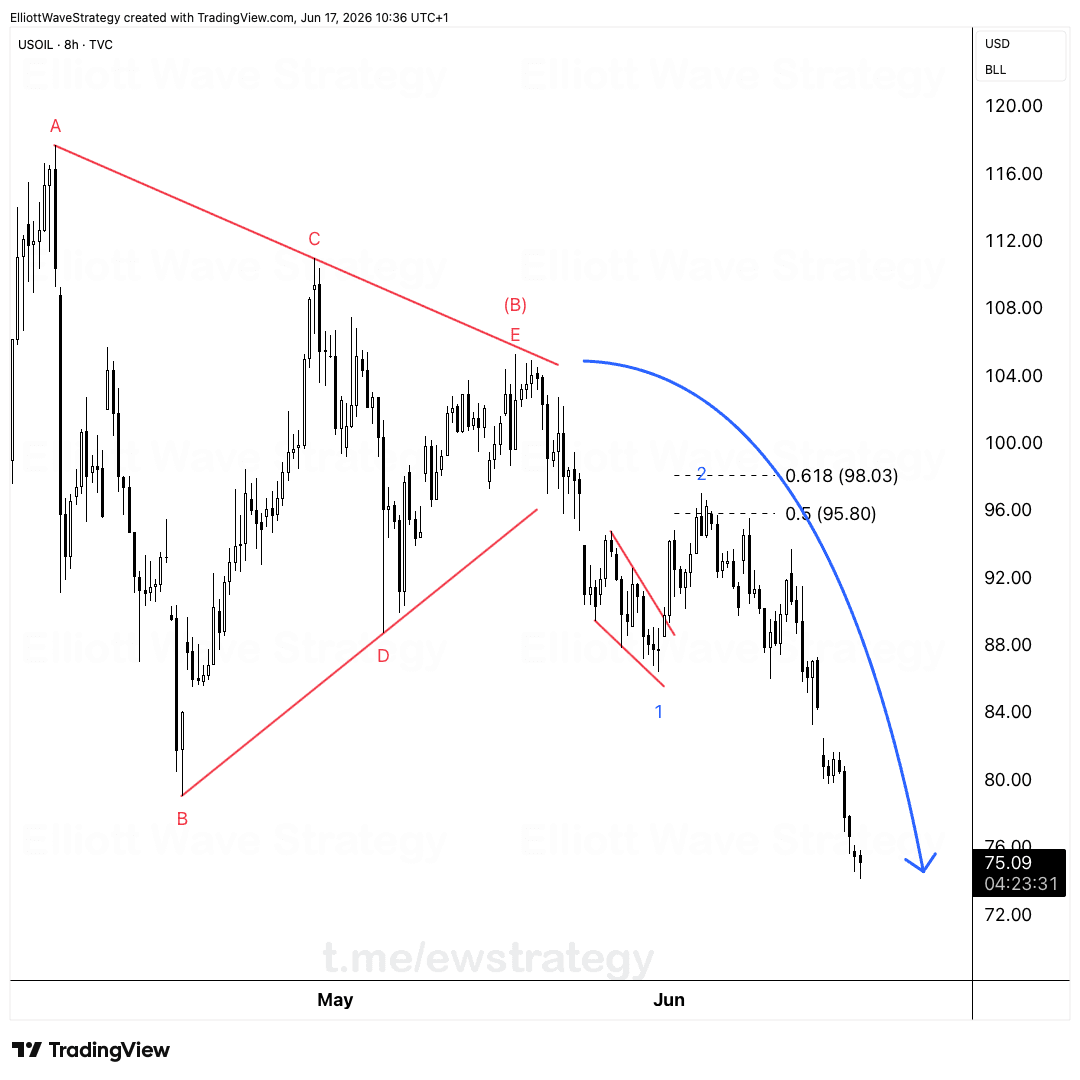
The E wave of the triangle completed right at our invalidation level, 105.21. No overshoot, no fake breakout, no hesitation. Then the floor gave way. Oil collapsed from 105 to 89.93 in six trading sessions on the 4h chart. Ten dollars, gone, in less than a week.
Why did the triangle at 105.21 matter so much?
Look at the chart structure. Points A through E trace a classic contracting triangle, with wave B at the low near 89 and wave C, D, E compressing into a tighter and tighter range as price climbed back toward 105.21. That convergence is the signature of a triangle. Price stops making progress and starts coiling.
The invalidation level at 105.21 wasn't arbitrary. It marked the boundary where the triangle count would have failed. Wave E touched that line and reversed immediately. That's confirmation, not guesswork. The structure told us where the ceiling was, and the market respected it.
What happened after the breakout?
Once E completed, the corrective sideways phase ended and the next impulsive leg began. USOIL didn't chop around after the break. It dropped in a straight line from 105 to 89.93. That's the thrust triangles are known for: sharp, fast, and in the direction the triangle was warning about.
Many traders bought the dips during the triangle formation itself. Every time price pulled back inside that range, buyers stepped in assuming the sideways action meant a bottom was forming. Sideways doesn't mean reversal. Sideways inside a triangle means preparation for the next move, and that move turned out to be lower.
Where is USOIL heading now under this Elliott Wave count?
The current read is that wave C of a larger correction is now in motion. The blue arrow on the chart shows the projected path: a corrective bounce first, then continuation lower toward the 80.00 region. This fits the standard behavior after a triangle resolves, where the thrust often extends well beyond the initial breakout candles before any meaningful pause.
The triangle gave the roadmap weeks in advance. The E wave gave the exact turning point. The breakdown followed the script. None of this required predicting the future, it required reading the wave structure and waiting for the market to confirm it.
Professional trading isn't about fighting a triangle once it's identified. It's about respecting what triangles do when they finish: they release energy fast, and they usually don't look back.
Key Takeaways
- •USOIL completed a contracting triangle with wave E topping exactly at the 105.21 invalidation level.
- •USOIL dropped from 105 to 89.93 in six trading sessions after the triangle breakdown.
- •Traders buying dips inside the triangle mistook sideways consolidation for a reversal signal.
- •The current Elliott Wave count has USOIL in wave C of a larger correction, with the projected path extending toward the 80.00 area.
- •The triangle pattern acted as a roadmap, with the breakout direction confirmed only after wave E completed at the invalidation line.
Frequently Asked Questions
What would invalidate the current bearish USOIL wave count?
A sustained move back above the 105.21 invalidation level, where wave E of the prior triangle topped, would undermine this bearish structure and require reassessing the count.
Why did USOIL fall so fast after the triangle formed?
Triangles compress price action into a tightening range, and once the pattern completes, the market typically releases that stored energy in a fast, directional thrust rather than a slow grind.
What is wave C in the current USOIL Elliott Wave structure?
Wave C refers to the third and final leg of the larger corrective structure now unfolding, which the chart projects continuing lower toward the 80.00 region after a brief corrective bounce.
Disclaimer: This analysis is for educational purposes only and does not constitute financial advice. Elliott Wave analysis involves subjective interpretation. Always do your own research and manage your risk accordingly.
Get Full Coverage for All 27 Instruments
Premium members receive daily wave counts with entry zones, targets and invalidation levels, published daily across all 27 instruments.
View Premium Plans