XAGUSD Elliott Wave: Two Paths for Wave (2) Retracement
You don't need to be right every time. You need to know what to do when you're wrong.
You don't need to be right every time. You need to know what to do when you're wrong.
That's how a setup should be approached. Map the possible scenarios first. Then figure out where an entry makes sense, where risk needs managing, and what level kills the idea entirely.
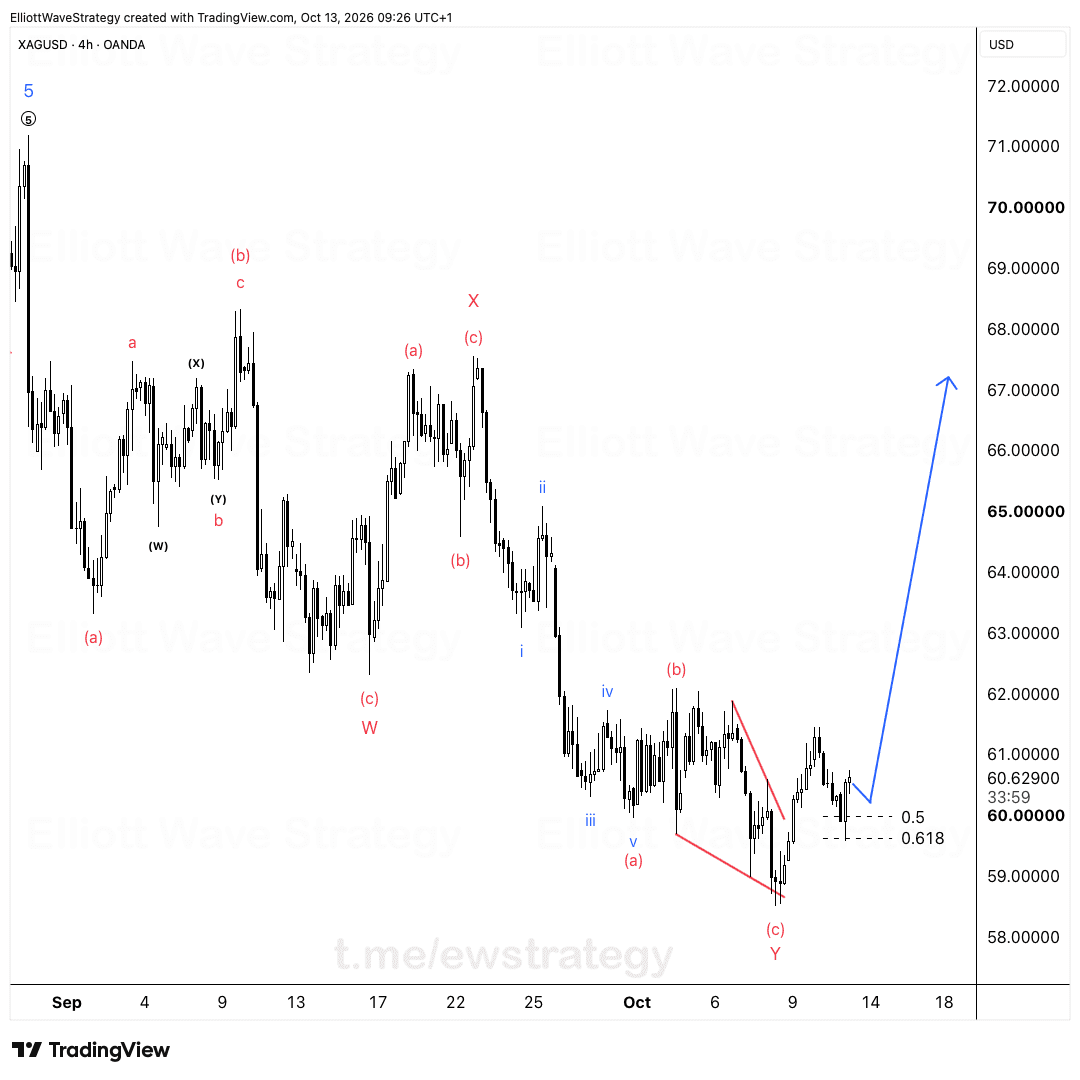
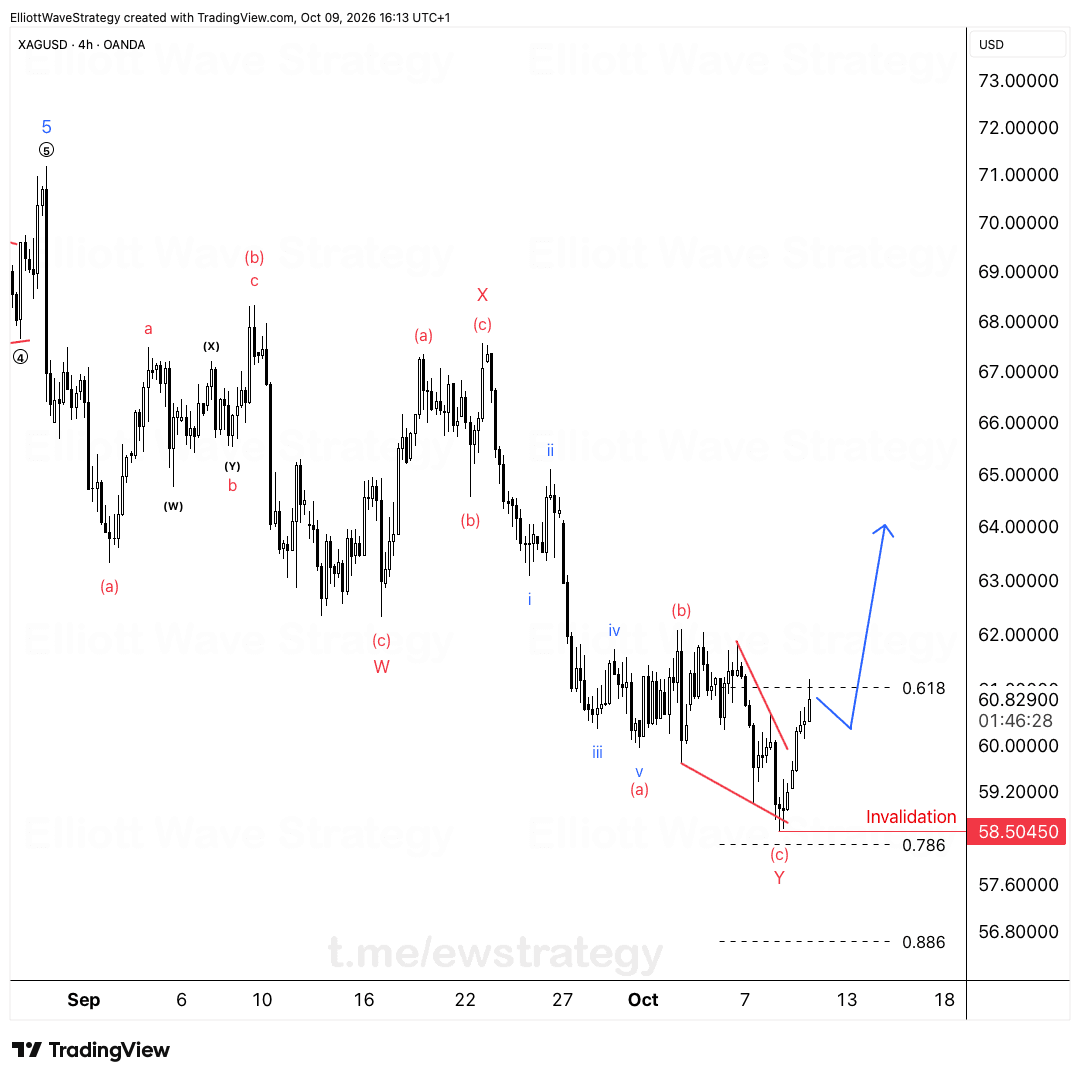
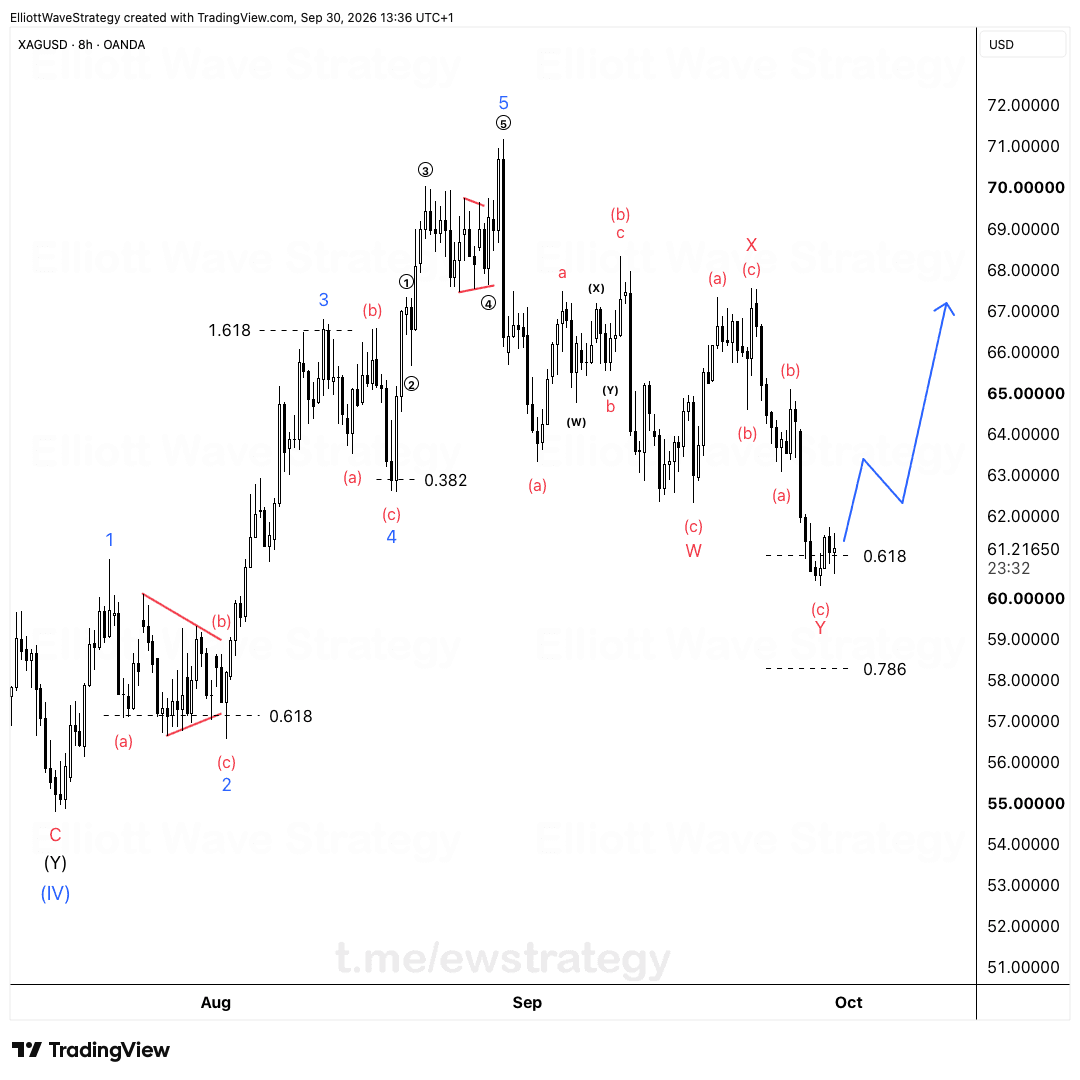
On XAGUSD, wave (2) is still developing after the sharp drop from the (1) high near 72.00. Two paths from here, each with its own entry and stop area.
What is the Alt 4 scenario on XAGUSD?
In this path, price finds support and builds a smaller bounce before continuing lower. The chart marks this bounce unfolding near the 0.5 retracement zone around 66.00, with a shallower structure than the alternative count.
Entry sits near that 0.5 zone. The stop is placed just above it, near 67.00, keeping risk tight if the smaller degree bounce fails and the decline resumes toward new lows below the labeled wave C.
The invalidation line for this alternate wave 4 count sits just above the recent swing, marked directly on the chart. A break above that level removes Alt 4 from consideration entirely.
What is the Alt (2) scenario on XAGUSD?
Here, a deeper retracement plays out first. Price pushes toward the 0.618 zone near 61.00 to 62.00 before the larger move resumes higher, matching the labeled wave (2) on the chart.
Entry and stop are mapped around that 0.618 level, with the stop placed just below it near 60.00. This is the deeper of the two paths, giving the correction more room before the next impulsive leg starts.
Both the Alt 4 and Alt (2) paths point toward the same broader direction once the retracement completes: a resumption of the upside move, with projected targets stretching toward the 1.0 and 1.272 extension zones near 69.00 and 71.00 on the chart's drawn projections.
Why map two scenarios instead of picking one?
Predicting which one plays out with full certainty is not the goal. The goal is having a plan for both.
Each scenario on the XAGUSD chart carries its own entry, its own stop, and its own invalidation. That structure means a trader already knows what wrong looks like before price gets there, instead of scrambling to figure it out in the moment.
The shallow Alt 4 bounce and the deeper Alt (2) retracement disagree on how far the pullback stretches. They don't disagree on the bigger picture: once wave (2) finishes, the larger wave count expects another leg higher.
Watching which zone gets tested first, the 0.5 area or the 0.618 area, will tell which of the two counts is actually the one in play.
Key Takeaways
- •XAGUSD is tracing wave (2) after the sharp decline from the (1) high, with two distinct retracement paths mapped.
- •The Alt 4 scenario on XAGUSD expects a shallower bounce near the 0.5 zone before the decline continues.
- •The Alt (2) scenario on XAGUSD expects a deeper pullback toward the 0.618 zone before the larger move resumes.
- •Both XAGUSD paths share the same longer term expectation: a resumption higher once the current retracement completes.
- •Each scenario carries its own entry, stop, and invalidation level drawn directly on the chart.
Frequently Asked Questions
What invalidates the Alt 4 count on XAGUSD?
A break above the invalidation line marked just above the recent swing high removes the Alt 4 shallow bounce scenario from consideration.
What is the difference between Alt 4 and Alt (2) on XAGUSD?
Alt 4 expects a smaller, shallower bounce near the 0.5 retracement before price continues lower, while Alt (2) expects a deeper pullback toward the 0.618 zone before the larger uptrend resumes.
Where are the entry and stop zones for the XAGUSD wave (2) setups?
For Alt 4, the entry sits near the 0.5 zone with a stop just above it. For Alt (2), the entry and stop are mapped around the deeper 0.618 zone.
Disclaimer: This analysis is for educational purposes only and does not constitute financial advice. Elliott Wave analysis involves subjective interpretation. Always do your own research and manage your risk accordingly.
Get Full Coverage for All 27 Instruments
Premium members receive daily wave counts with entry zones, targets and invalidation levels, published daily across all 27 instruments.
View Premium Plans