XAUUSD Elliott Wave: Why Wave Z Must Finish First
The Hardest Part of Trading: Watching the Setup Form Without Acting
Gold is teaching a lesson right now that has nothing to do with charts and everything to do with psychology. The roadmap on the XAUUSD 4h chart is obvious. The timing isn't ready yet.
Price is grinding higher inside what looks like the final leg of a complex correction. Wave Z needs to complete before the real move begins. Most traders watching this rally are already telling themselves they're missing out. That's exactly the trap this structure is built to spring.
What does the XAUUSD chart actually show?
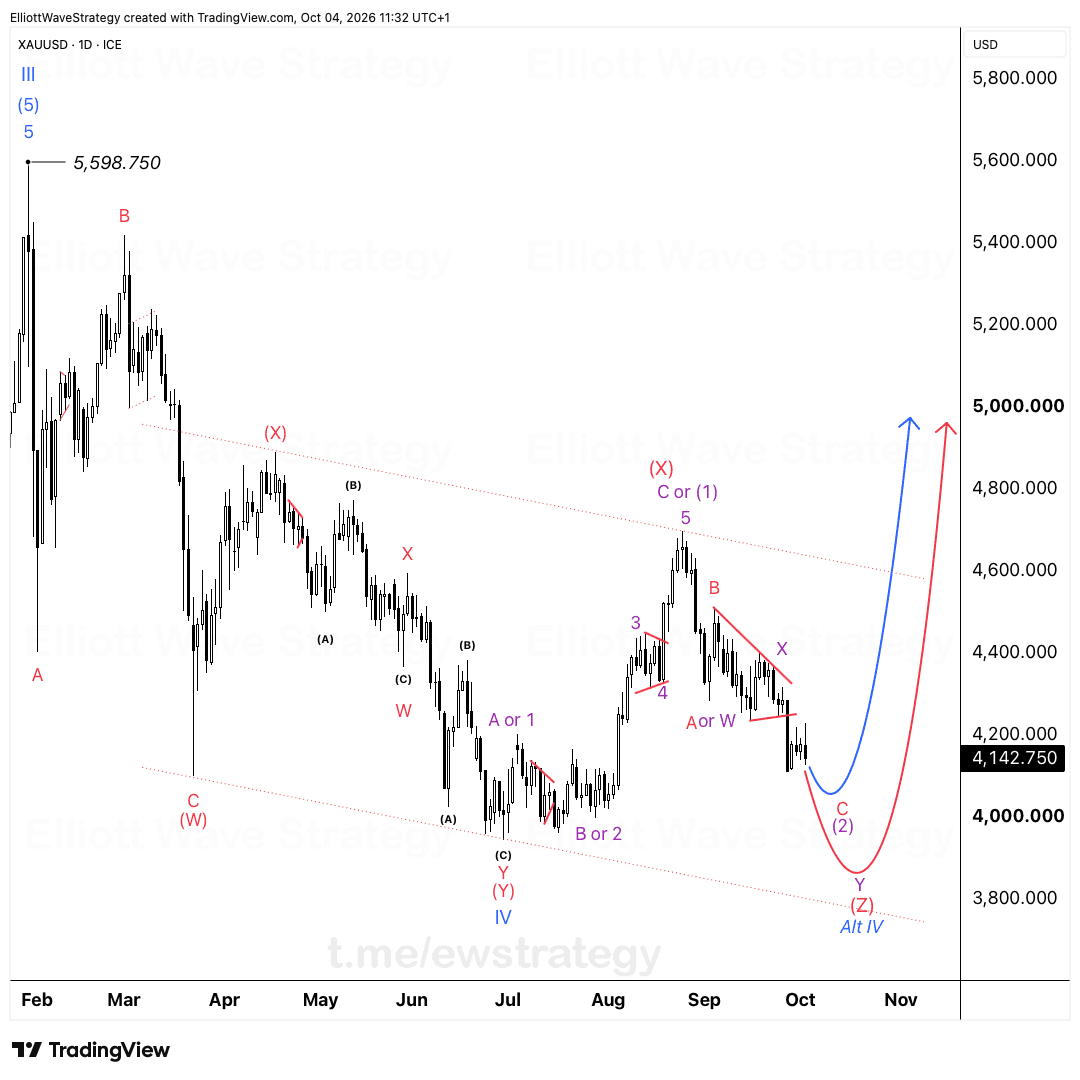
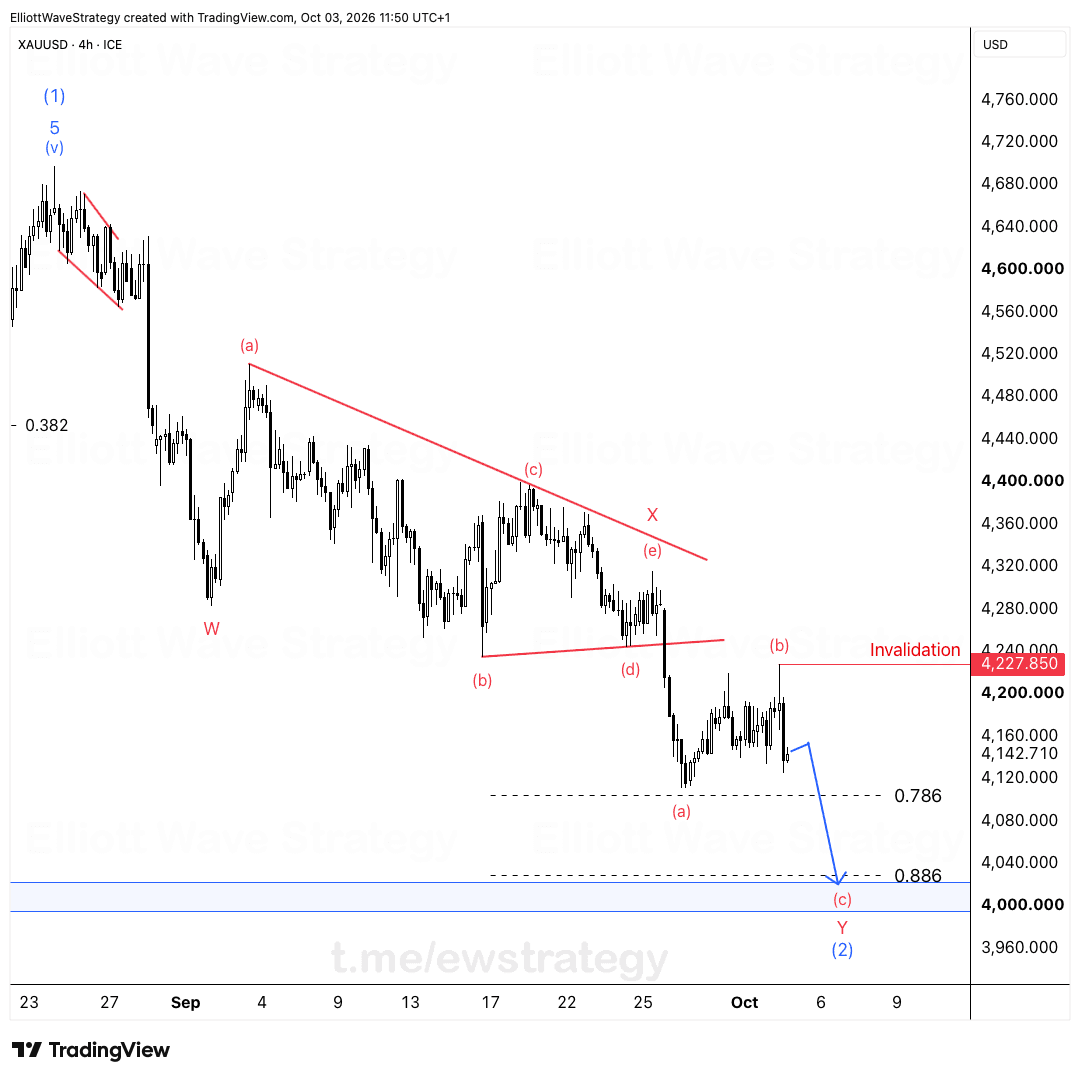
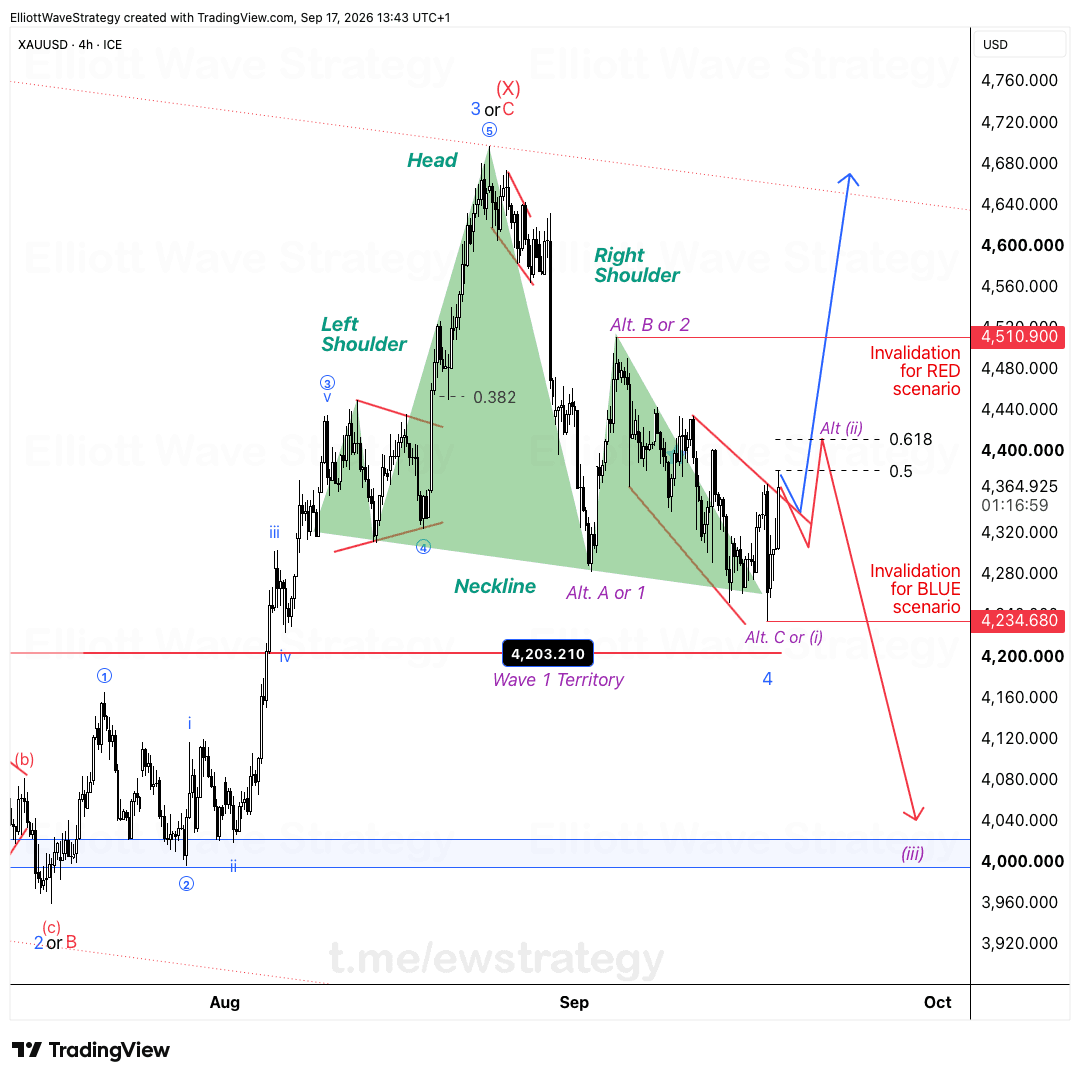
Zoom out and the count is layered. Gold completed a large Wave (5) down into the Y leg of a bigger correction, then built a W-X-Y structure off that low. That Y wave itself broke down into a smaller W-X-Y, and right now price is tracing the final A-B leg of what's labeled X, the third connector in a double or triple three correction.
The current push up from the B low is corrective in character, not impulsive. That distinction matters more than anything else on this chart. An impulsive move up would suggest trend continuation. A corrective push into resistance near the upper channel line, the one connecting back to the (X) and X pivots earlier in the pattern, suggests the opposite: exhaustion, not strength.
Why do early entries kill accounts, not bad entries?
Cetin's point cuts straight to the core of retail trading. Watching price climb and jumping in because you're afraid of missing out feels like action. It's actually the opposite of a plan.
The traders who get crushed here aren't making bad technical calls. They're making a timing call without waiting for the market to confirm it. They buy into what the chart is showing as Wave Z, assume it's the start of a new uptrend, and hold through the reversal because admitting the entry was early feels worse than losing money slowly.
Real patience isn't gritting your teeth through a losing position for weeks hoping it turns around. Real patience is staying flat while the setup completes exactly as the wave count says it should.
What happens once Wave Z completes on XAUUSD?
The projected path on the chart is a sharp move down once this corrective structure finishes. The blue trajectory drawn from the current price zone points toward the 4,545 area, a clean break below the rising channel that's guided price since the (5) low.
That's the heavy drop Cetin references. It doesn't arrive because a trader wills it to happen. It arrives once the wave structure finishes doing what corrections do: trap the crowd, then reverse.
Confirmation will come from price action breaking the rising trendline that's supported this entire W-X-Y-X sequence. Until that break happens, the count remains a correction, not a new bull trend.
The takeaway for anyone watching gold right now
The job today isn't predicting the exact hour Wave Z tops. The job is recognizing that this is a corrective structure near its end, not an impulsive move at its start, and letting the chart confirm before acting on it.
Key Takeaways
- •XAUUSD is completing the final Wave Z of a complex W-X-Y-X-Y correction on the 4h chart.
- •The current rally in XAUUSD is corrective, not impulsive, which is why chasing it now is risky.
- •A break of the rising trendline would help confirm that Wave Z has completed on gold.
- •The projected path for XAUUSD points toward the 4,545 region once the correction finishes.
- •Early entries, not bad entries, are what typically damage trading accounts during corrective structures like this one.
Frequently Asked Questions
Is XAUUSD in an uptrend or a correction right now?
According to this Elliott Wave count, gold is inside the final leg of a corrective structure labeled Wave Z, not a fresh uptrend, which is why the current rally looks tempting but hasn't been confirmed as trend continuation.
What would confirm that Wave Z has completed on gold?
A break below the rising trendline connecting the recent B and X pivots on the 4h chart would signal that the correction has likely finished and the anticipated decline is beginning.
Why does Cetin say early entries are more dangerous than bad entries?
Because an early entry during an unfinished correction can look right for days or weeks before reversing hard, tempting traders to hold losing positions instead of admitting the timing was off.
Disclaimer: This analysis is for educational purposes only and does not constitute financial advice. Elliott Wave analysis involves subjective interpretation. Always do your own research and manage your risk accordingly.
Get Full Coverage for All 27 Instruments
Premium members receive daily wave counts with entry zones, targets and invalidation levels, published daily across all 27 instruments.
View Premium Plans