
VIX Is Not Tradable, and VXX Proves It
The volatility index has no contract behind it. What you buy is a rolling futures position. A modelled year of daily rolls loses 49.20% with the index standing still, and the index has to gain 33.98%
Quick answer: A volatility index is a calculation derived from option prices, not a security. There is no contract at the index level, so nothing can be bought there. What is actually bought is a long position in the two nearest volatility futures, reweighted every day to hold an average maturity of thirty days. Those futures normally trade above spot in a calm market, so the position pays a premium every single day it is held. In the model below, that costs 49.20% over a year with the index perfectly unchanged, and the index has to gain 33.98% before the product finishes flat.
Every risk desk watches it. Every macro note quotes it. And the number on that chart cannot be bought at any price, by anyone, through any broker.
That gap between what is watched and what is owned is the entire subject here. The exchange traded products people use to express a volatility view are not tracking failures or badly run funds. They do exactly what their prospectus says. The construction itself guarantees that the thing you hold and the thing you are looking at will diverge, and the divergence compounds every day the market is calm. VXX is simply the best known example of that construction. Nothing in this article quotes a level or a return for it, or for any named index. Every number here comes out of a stated model.
The index is a calculation, not a security
A volatility index is computed from a strip of option prices across strikes, annualised, and expressed as an implied move over the next thirty days. It updates continuously. It has a chart, a ticker and a history.
It has no contract. Nothing settles against it directly, nothing can be delivered, and there is no position to hold at that number. The chart is a readout, in the same way that a barometer reading is not a thing you can own a barrel of.
What does exist is a futures market on that index, with monthly expiries. Each contract settles at the index level on its settlement date, and before that date it trades wherever the market thinks the index will be then. That is a different number from where the index is today, and the difference is not small.
Model the curve and the gap appears immediately
Set up the simplest term structure that behaves like a real one. The index sits at 16.00 points in a calm market. The market prices reversion toward a long-run level of 20.00 at a speed that closes half of any gap in roughly sixty three days.
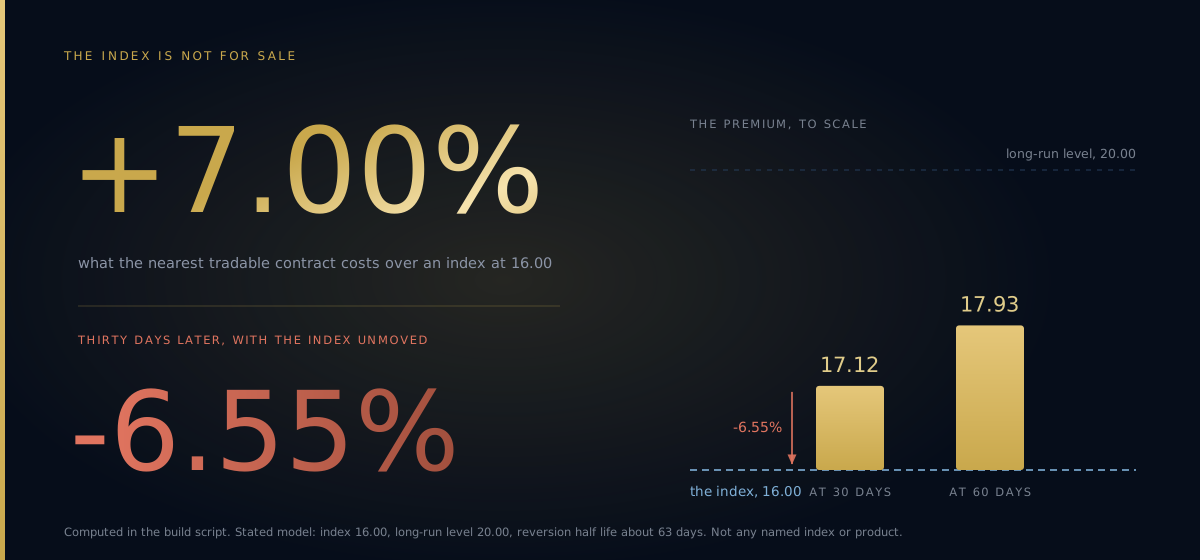
Every futures price then falls out of one equation. The thirty day contract prices at 17.12, which is a premium of 7.00% over spot. The sixty day contract prices at 17.93.
Now hold that thirty day contract to expiry with the index unchanged. It settles at 16.00. You paid 17.12. That is -6.55% over thirty days, on a position whose underlying went precisely nowhere.
What the product actually holds
A constant maturity product does not buy one contract and wait. It holds the two nearest expiries and shifts one thirtieth of its weight from the near one to the next one every trading day, so the weighted average maturity stays pinned at thirty days.
That design solves a real problem. Without it the product's sensitivity would swing wildly as expiry approached, and the fund would face a single large transaction every month.
It also means the roll never stops. No day off, no waiting for a better level, no discretion. Every day the fund sells a bit of the cheaper near contract and buys a bit of the more expensive far one, and in a contango curve that is a small, mechanical, permanent transfer of value away from the holder.
| The index | The rolling product | |
|---|---|---|
| What it is | A calculation from option prices | A long position in two futures contracts |
| Can it be bought | No | Yes |
| What it measures | Implied move over the next thirty days | The value of a specific rolled futures book |
| Cost of holding | None, it is a number | The curve slope, charged daily |
| Behaviour in a calm market | Drifts sideways | Grinds down continuously |
| Behaviour in a shock | Jumps immediately and fully | Jumps partially, lags the index |
| Sensible holding period | Not applicable | Days |
| What decides your outcome | The index level | The index level and the shape of the curve |
The last row is the one worth sitting with. Two variables decide the trade and most people are only watching one of them.
A year of daily rolling with nothing happening
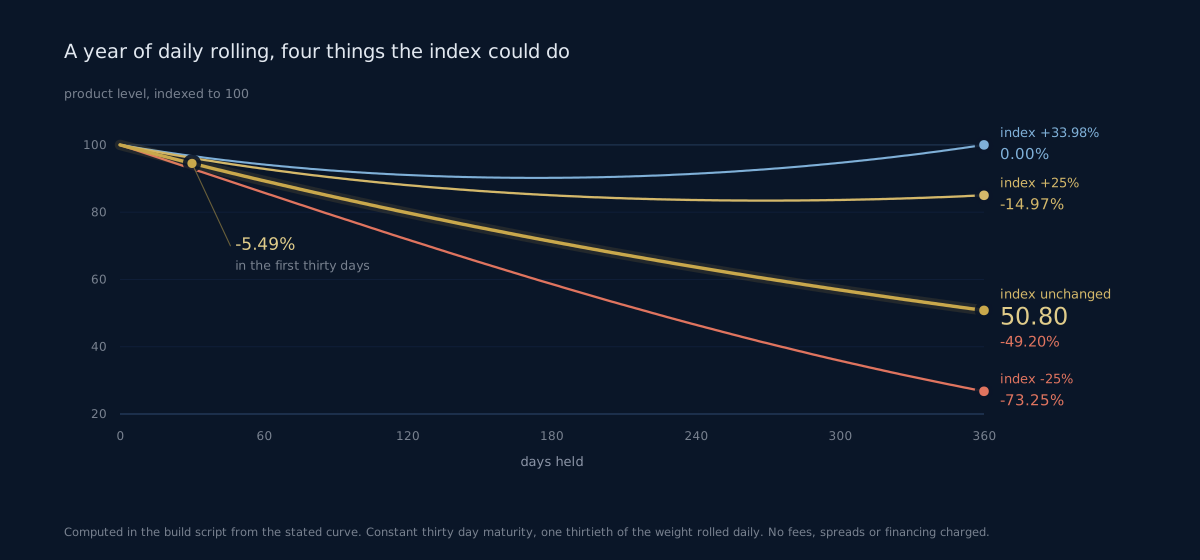
Run the simulation. The index is pinned at 16.00 for three hundred and sixty days. No crash, no spike, no news, no adverse move of any kind. The product rolls daily off the same modelled curve, with no fees, no spreads and no financing charged anywhere.
It finishes at 50.80. That is -49.20% over the year.
Half the capital is gone and nothing happened. There is no adverse price move to point at, no bad entry to regret and no stop that would have helped. The decay is not a risk that materialised. It is the product working as designed.
| One year scenario | Index | Product | Gap |
|---|---|---|---|
| Index unchanged | 0.00% | -49.20% | -49.20% |
| Index rises 25% | +25.00% | -14.97% | -39.97% |
| Index falls 25% | -25.00% | -73.25% | -48.25% |
| Move needed to finish flat | +33.98% | 0.00% |
Read the middle row twice. A view that turned out to be right by twenty five percentage points over a year still lost money. The index would have had to gain almost thirty four percent for the position to break even, and in this model that requires the index to end the year above its own long-run level, which is another way of saying it requires the calm regime to be over.
The shock, and how briefly it pays
None of that means the trade never works. It works, and when it works it is spectacular. It is also short.
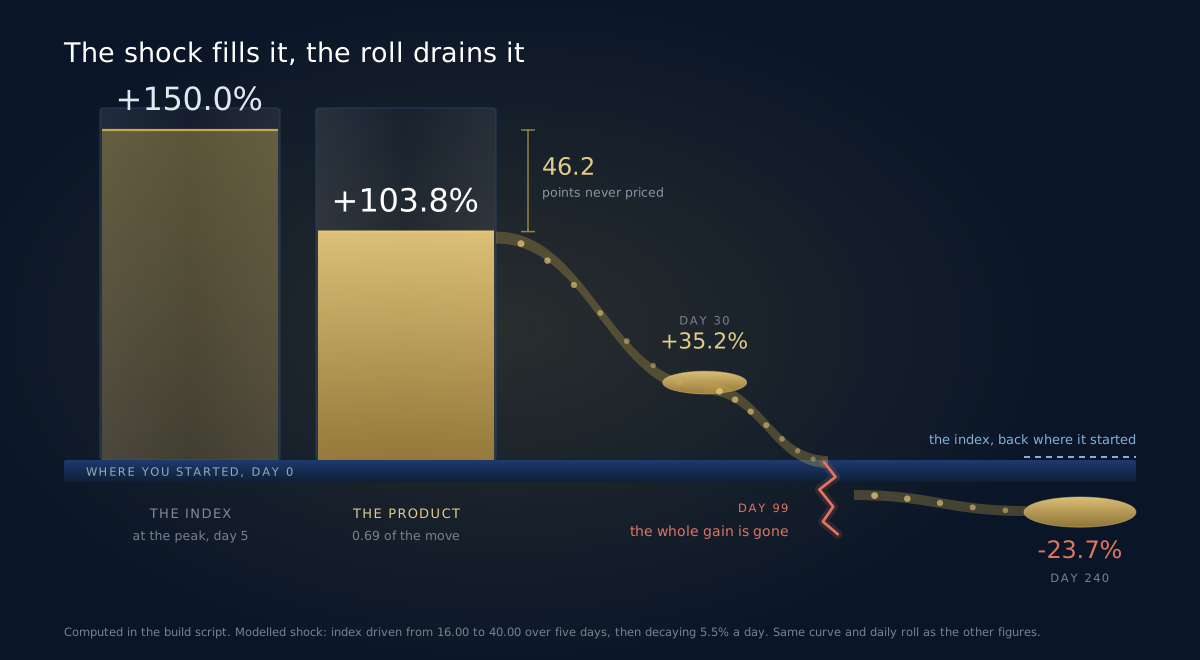
Model a shock. The index is driven from 16.00 to 40.00 over five days, a gain of 150%, then decays back toward its starting level over the following months. The same curve equation inverts into backwardation automatically while spot sits above the long-run level, which is exactly why the product can keep up at all during the panic.
At the peak the index is up 150% and the product is up 103.8%. That is a capture ratio of 0.69, and it is roughly what to expect: the product owns futures that never fully price the spike, because the market does not believe a 40.00 reading will still be there in thirty days.
Then the curve normalises and the meter restarts. By day 30 the index is up 37.9% and the product is up 35.2%, still respectable. By day 60 the product is ahead of the index on a relative basis, because backwardation briefly paid it. By day 99 the entire gain has been handed back. At day 240 the index is exactly where it started and the product is down 23.7%.
The rule that follows
Volatility exposure through a rolling product is measured in days. Never in months.
This is not a risk-tolerance preference or a style choice. It falls out of the arithmetic. A position that costs roughly 5.49% every thirty days to maintain, in a market where the underlying is mean reverting by construction, has a shelf life. The only question is whether you set the expiry date or the product sets it for you.
Three practical rules follow from the model.
Put the exit on the calendar before you put it on the chart. Decide the maximum number of days you will hold before you enter, and treat that as a hard limit that overrides the count. A structure that has not resolved in the time you allowed is a structure you no longer have the budget to wait for.
Size for the decay, not just the move. The daily bleed is a known cost. Deduct it from the expected payoff before deciding whether the trade clears your risk-reward threshold, in the same way you would deduct a spread.
Never hold one as a portfolio hedge. This is the most expensive mistake in the category, and it is common. A standing volatility position as insurance against a crash that arrives at an unknown date is a position that pays out at roughly two thirds of the move, after having spent a year losing half its value waiting.
What it does to a wave count
Counting waves on a volatility product is a different exercise from counting waves on the underlying index, and the difference is systematic rather than random.
The product's chart has a permanent downward bias built into it. Every corrective structure looks slightly deeper than the underlying's, every impulse up looks slightly weaker, and over enough time the whole series has a drift no market participant produced. A long-term channel drawn on that chart is describing the roll schedule as much as it is describing sentiment.
More concretely: a fifth wave that fails to make a new high on the product may have made a clean new high on the index. The truncation is arithmetic, not structural. Read the count on the index, which is a clean read of collective positioning, then decide separately whether the instrument can deliver it over the horizon your count implies.
Invalidation levels have the same problem in reverse. A level that sits below current price on the index sits closer, in percentage terms, on the product, because the product is falling toward it whether or not the market does anything. Set the invalidation on the index and translate it into a time limit on the product, not into a price.
The leveraged and inverse versions are worse
Short volatility products invert the sign, so they collect the roll instead of paying it, and in a calm market they compound upward with beautiful consistency. That is precisely the problem. The strategy earns steadily for long stretches and then meets a shock of the kind modelled in figure 3, where the underlying gains 150% in five days against a position that is short it.
Leveraged versions multiply the daily return, which multiplies the daily decay as well as the daily gain. Add the drag that any daily-rebalanced leveraged product carries and the calm-market bleed goes from severe to structural. Almost nobody should hold either of these for more than a few sessions.
Before you take the trade
1. Check the curve, not just the index. Two contracts give you the slope and the sign. 2. Convert the slope into a daily cost and multiply by the days you intend to hold. 3. Write the exit date down. Put it next to the price stop, not below it. 4. Deduct the expected decay from the expected payoff before you size anything. 5. Confirm the count on the index, then confirm the instrument can survive the timeline that count needs.
Quick facts
- A volatility index is computed from option prices and has no contract at the index level, so it cannot be bought.
- The tradable expression is a long position in the two nearest volatility futures, reweighted daily.
- In the model here, the thirty day contract carries a 7.00% premium over an index at 16.00 points.
- Holding that contract to expiry with the index unchanged returns -6.55% over thirty days.
- Rolled daily for a year with the index flat, the modelled product loses 49.20%.
- The modelled index has to gain 33.98% over the year for the product simply to finish flat.
- In the modelled shock, the product captured 0.69 of a 150% five-day move in the index.
- The entire gain from that shock was given back by day 99, with the index still slightly above where it started.
Frequently asked questions
Why can I not just buy the index directly? Because it is a number, not an asset. It is derived from the prices of options on something else, and there is no counterparty who can deliver it to you. Exchanges list futures and options on the index, and every tradable volatility product is built out of those.
Is the decay a fee the issuer is charging me? No. Management fees exist and are disclosed, but they are a rounding error next to this. The decay is the shape of the futures curve, and the issuer collects none of it. It goes to whoever sold you the contracts.
Does the product ever gain in a calm market? Only when the curve is flat or inverted, which in a calm market is rare and short-lived. In the model, an index sitting at the long-run level produces a flat curve and no decay at all. Below that level the curve slopes up and the meter runs.
How long is too long to hold one? Long enough that the accumulated decay is a meaningful fraction of your expected payoff. With a bleed near 5.49% a month, a trade expecting a 30% move has spent more than a third of it after two months. Most practitioners who use these successfully are measuring the hold in sessions.
Are the mid-term products with longer maturities better? They decay more slowly, because the curve is flatter further out, and they respond far less to a shock, which is the reason you wanted the exposure. You are trading capture ratio for shelf life.
Can I use a volatility product to confirm an index count? Use the index itself for that. The product carries a construction-driven drift that will bias any structural read on it, and the index is published continuously with no such distortion. Confirm on the index, execute wherever the instrument is honest about its horizon.
MEASURE THE STRUCTURE, THEN MEASURE THE CLOCK. EW Strategy publishes daily Elliott Wave analysis across 27 instruments spanning FX, commodities, indices and crypto, on H4, Daily and Weekly. Annotated PDF reports, EWS Helix on WhatsApp for a second opinion when volatility arrives overnight, and the position sizing and risk-reward calculators for turning a horizon into a size.
Further reading
Frequently asked questions
What is Elliott Wave analysis?+
Elliott Wave analysis is a form of technical analysis based on the theory that financial markets move in predictable wave patterns reflecting crowd psychology. Markets advance in five-wave impulse patterns and correct in three-wave patterns.
How accurate is Elliott Wave analysis?+
Accuracy depends on the analyst's skill, the instrument, and how the result is measured. At EW Strategy, every published call carries a direction, target levels and an invalidation level stated in advance, and every outcome is recorded against them. We are rebuilding that record from the raw archive under a measurement rule published before any figure, and we would rather show nothing than a headline number we cannot defend.
Can Elliott Wave analysis be used for day trading?+
Yes. Elliott Wave patterns appear at all timeframes, from 1-minute charts to monthly charts. Day traders typically focus on sub-minuette and minuette degree waves for intraday setups.
Elliott Wave analyst with 15+ years of experience. Covers 27 instruments daily across Forex, Commodities, Indices and Crypto. Founder of Artavest Oy, Helsinki.