
Gold Is Not Only a Chart
Most gold demand argues with the price. One slice of it does not. On a stated model market, swapping a price-chasing buyer for an indifferent one of the same size takes 2.8 points off a 26.1 point
Quick answer: A gold price is the level at which one year of mine output and recycled metal meets one year of jewellery, technology, investment and official demand. Most of that demand argues with the price: it takes more when metal gets cheaper and less when it gets dear. One slice does not argue, because a buyer working a tonnage mandate takes the same quantity whatever the screen says. On a stated model market of 1,000 units a year, swapping a price-chasing slice for an indifferent one of the same size takes 2.8 points off a 26.1 point correction. Real, worth knowing, and about a ninth of the move.
You can trade gold for years without asking who is on the other side of the print. The chart is enough. It has structure, it has degree, it retraces to levels that keep working, and none of that requires knowing whether the metal ended up in a vault in Zurich or a ring in Chennai.
Then something changes in who owns it, and the chart starts behaving differently at the same Fibonacci levels. Corrections that used to run deep stop running as deep. Not because the wave rules changed. Because the population willing to sell into weakness got smaller, and the arithmetic of clearing a market is unforgiving about that.
What a gold price is, physically
Every year a quantity of metal comes out of the ground and out of scrap drawers, and a quantity gets bought by people who want it for different reasons. The price is whatever number makes those two equal. That is the whole model, and it sounds too simple to be useful right up until you notice that the two sides are not symmetric in their willingness to argue.
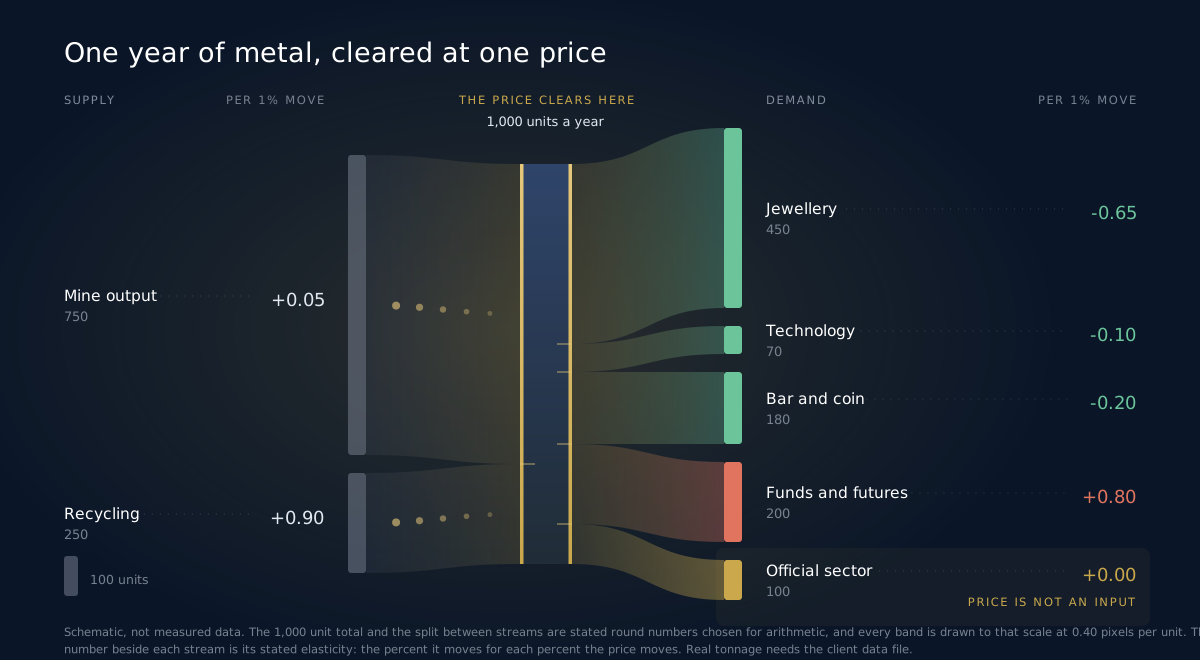
Everything below runs on a stated hypothetical market of 1,000 units a year, split in round numbers. The split is not tonnage from any report. It is arithmetic scaffolding, chosen so every result can be reproduced by running the build script that made the figures.
Which buyers argue about price, and which do not
Elasticity is the number that matters here. It says how many percent a stream moves for each percent the price moves, and its sign says which way.
Negative on the demand side means the buyer takes more when metal gets cheaper. Ordinary consumer behaviour, and stabilising, because a falling price recruits buying that was not there before. Positive on the demand side is strange for a consumer and completely normal for a financial allocator. A fund that adds on strength and faces redemptions on weakness has a positive demand elasticity whether or not anyone has described it that way.
| Demand stream | Elasticity used | Behaviour | What it does in a falling market |
|---|---|---|---|
| Funds and futures | +0.80 | procyclical | sells into the fall, deepens it |
| Jewellery | −0.65 | consumer | buys the fall, cushions it |
| Bar and coin | −0.20 | mildly bargain seeking | buys a little more, cushions a little |
| Technology | −0.10 | inelastic industrial | needs what it needs, barely moves |
| Official sector | 0.00 | mandate driven | takes the same quantity either way |
Those elasticities are stated assumptions, not estimates from a published study. Argue with any of them and the numbers below move. The ranking does not, because the ranking follows from what kind of decision each buyer is making.
A jeweller is running a shop. A fund is running a mandate with a benchmark and a redemption queue. A reserve manager is running an allocation target expressed in tonnes, approved by a committee, with a multi-year horizon and no requirement to explain a bad quarter. Only one of those three has a reason to care where the price closed on Friday.
Supply argues too, and half of it argues fast
The supply side gets less attention than it deserves, and its two streams have almost nothing in common.
Mine output answers a price signal on a timescale of about a decade. Permits, shafts, mills, water rights. Nothing about a good year for the price produces metal this year, which is why it sits at +0.05 here, close enough to a fixed quantity that the distinction rarely matters inside a trade.
Recycling is the underrated half of the story. Scrap answers within weeks. Price rises, and metal that was sitting in a drawer as jewellery becomes metal sitting in a refinery as supply. Fast, elastic, and the reason gold rallies carry a natural brake that most commodity rallies do not.
The experiment: one shock, three kinds of buyer
The design of the test matters more than the result.
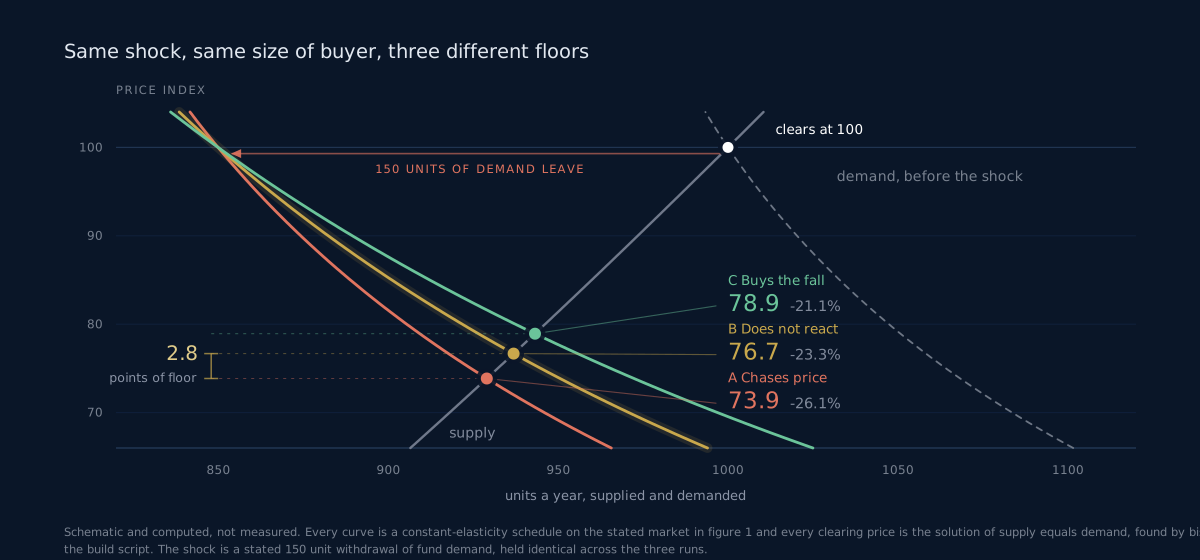
A shock arrives. Something removes 150 units of fund demand from a 1,000 unit market, which is what a risk-off week or a repricing of real rates looks like from the metal's point of view. That shock is held identical across all three runs.
The only thing that changes is how a separate 100 unit slice behaves. Same size in all three cases, so all three markets start at exactly the same price.
| The 100 unit slice | Elasticity | Clears at | Depth of the fall |
|---|---|---|---|
| A fund that chases price | +0.80 | 73.9 | −26.1% |
| An official buyer with a tonnage mandate | 0.00 | 76.7 | −23.3% |
| A private buyer that behaves like jewellery | −0.65 | 78.9 | −21.1% |
Read the middle row against the top one. That is the entire claim about official buying, stated honestly and with a number attached to it.
So what is an indifferent buyer actually worth?
Two point eight points of price, on a fall of twenty six. About a ninth.
Real, and smaller than almost every version of this story you will read. The mechanism is worth being precise about, because the popular version has it backwards.
An official buyer does not cushion a correction by buying the dip. It has no view on the dip. What it does is refuse to become a seller, and refuse to shrink, in the week when everyone else is doing both. A hole in the supply of panic. Nothing more heroic than that, and nothing less useful.
Notice the third row too. A buyer that truly absorbs, taking more as price falls, does roughly twice the work of an indifferent one. The most stabilising force in this market is not the reserve manager. It is the wedding season.
Why "floor" is the wrong word
Push the model harder and the language problem becomes obvious.
Ask what share of the market has to stop reacting to price before the correction is merely half as deep. The answer here is 78%. Not the official slice, not a third: more than three quarters of everything, recycling and jewellery included, would have to go indifferent before a shock of this size lost half its force.
No gold market has ever looked remotely like that.
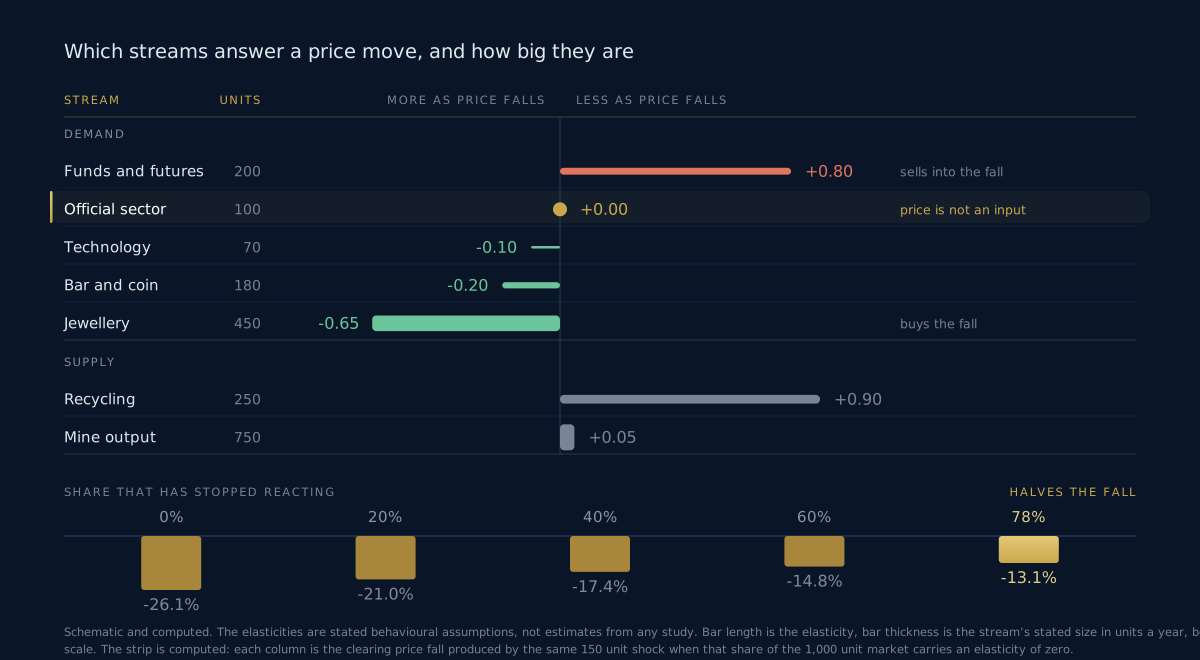
So the accurate sentence is that official buying raises the floor. It does not build one. The difference sounds pedantic until you size a position on it.
What it changes in a corrective count
None of this tells you where a correction ends. It tells you something narrower: what the distribution of plausible depths looks like.
A wave two or a wave four has a range of normal retracements, and which part of that range you weight depends on who has to sell. When the marginal holder is levered and procyclical, the deep end is live and the shallow readings are wishful. When a slice of that marginal holder is indifferent to price, the same count has its probability mass pushed toward the shallower retracements. Same rules, same invalidation, different odds inside the range.
Two consequences follow, and only two.
The first is which retracement you plan for. If ownership has shifted toward mandate-driven holders, a 0.618 retracement stops being the automatic assumption, and you size entries across the range rather than waiting at the deep end for a fill a stiffer market may never hand you.
The second is what a break means. A level that fails with a large indifferent buyer present tells you more than the same level failing without one, because more was standing behind it. Better information, not noise.
What does not change is the invalidation level. Structure sets that and physical demand has no vote. If the count says the low invalidates the reading, it invalidates the reading, and no reserve manager will be consulted about it.
Where this model is weak
Three objections. The first one is the serious one and it applies to every flow model of gold ever built.
Annual mine output and annual fabrication demand are small next to the metal already above ground and next to the volume that trades through futures and the London market on any given day. Price formation in real time happens in that turnover, not in the physical balance. This model describes the level around which the turnover has to settle over a year or more, which is exactly why it says nothing about next Tuesday.
Second, the official sector's behaviour is a decision rather than a law of physics. Reserve managers can sell, have sold, and will sell again when the reasoning behind the accumulation stops applying. An elasticity of zero says how that slice responds to price, not that it responds to nothing.
Third, the elasticities are assumptions, chosen to be defensible rather than precise. The ordering of the five categories is far more robust than any single number in the table.
How to use this without over-reading it
Keep it as a prior on depth, never as a signal. It has no timing content at all and anyone who tells you otherwise is selling something.
Check the composition question once a quarter. Ownership shifts show up in annual tonnage tables and reserve statistics, on a lag, and they matter over the horizon of a Weekly count rather than an H4 one.
Watch recycling as the ceiling. When price runs hard, scrap arrives fast, and a fifth wave into an elastic supply response carries a headwind a purely structural read will miss.
Keep the two frames separate. Physical balance tells you the level a market has to settle around. Wave structure tells you the path and where the reading breaks. Mixing them produces the worst of both.
Quick facts
- A gold price is the level at which one year of supply equals one year of demand, so every category that changes its mind about price helps set it.
- On the stated model market, three demand streams buy more as price falls, one buys less, and one does not respond at all.
- Funds and futures carry a positive demand elasticity, so in aggregate they sell into weakness rather than buy it.
- Recycling is the fast half of supply and answers within weeks; mine output answers on a decade.
- Swapping a price-chasing 100 unit slice for an indifferent one of the same size lifts the clearing price from 73.9 to 76.7, taking 2.8 points off a 26.1 point fall.
- A slice that actively buys the fall does roughly twice that work, lifting the same clearing price to 78.9.
- Halving the correction on this model would take 78% of the whole market becoming indifferent to price.
- No tonnage figure and no gold price appears in this article. Those need the measured data series.
Frequently asked questions
Does central bank buying put a floor under gold? It raises the floor and does not build one. On the model above the effect is about a ninth of the correction, real and much smaller than the phrase implies. The mechanism is subtraction rather than support: an indifferent buyer is one fewer seller in the week when sellers are what the market has too many of.
Why is fund demand modelled as positive elasticity? Funds buy dips. Some do. In aggregate the flow does not, because it is governed by redemptions and by mandates that trim risk after drawdowns, and both arrive after a fall rather than before it. Point to a fund complex whose net flow is reliably countercyclical and the cushion in figure 2 gets bigger.
Do I need the tonnage numbers to use any of this? For the structural conclusion, no. The ranking by price sensitivity does the work, and that ranking follows from what kind of decision each buyer is making. Tonnage decides how big the effect is, not which direction it runs.
Does this change where I put an invalidation level? No. Invalidation is structural and physical demand has no vote on it. What changes is the retracement you plan for inside a valid count, and the weight you give a break of a level that had a lot standing behind it.
Is jewellery really more stabilising than official buying? Per unit of demand, yes, on any elasticities where jewellery is price sensitive and the official sector is not. The result surprises people because jewellery has no narrative attached to it. A buyer who shows up because the metal got cheaper is doing more for the price than a buyer who was going to show up anyway.
How does this interact with the dollar? Everything above is stated in dollar terms and a good part of jewellery demand is not. When the dollar moves hard, the local currency price faced by the largest consumer markets moves differently from the screen, which changes the elasticity you should be using. Read gold alongside the dollar complex, not on its own.
THE COUNT GIVES YOU THE SHAPE. THE OWNERSHIP GIVES YOU THE DEPTH. EW Strategy publishes daily Elliott Wave analysis across 27 instruments, 11 FX pairs, 4 commodities, 5 indices and 7 crypto, on H4, Daily and Weekly. Annotated PDF reports on XAUUSD and XAGUSD, EWS Helix on WhatsApp when a level goes while you are away from the screen, and the Fibonacci, position sizing and risk and reward calculators for the part that is arithmetic.
Further reading
Frequently asked questions
What is Elliott Wave analysis?+
Elliott Wave analysis is a form of technical analysis based on the theory that financial markets move in predictable wave patterns reflecting crowd psychology. Markets advance in five-wave impulse patterns and correct in three-wave patterns.
How accurate is Elliott Wave analysis?+
Accuracy depends on the analyst's skill, the instrument, and how the result is measured. At EW Strategy, every published call carries a direction, target levels and an invalidation level stated in advance, and every outcome is recorded against them. We are rebuilding that record from the raw archive under a measurement rule published before any figure, and we would rather show nothing than a headline number we cannot defend.
Can Elliott Wave analysis be used for day trading?+
Yes. Elliott Wave patterns appear at all timeframes, from 1-minute charts to monthly charts. Day traders typically focus on sub-minuette and minuette degree waves for intraday setups.
Elliott Wave analyst with 15+ years of experience. Covers 27 instruments daily across Forex, Commodities, Indices and Crypto. Founder of Artavest Oy, Helsinki.