BTCUSDT Elliott Wave: Why the 62K Bottom Is Not In
BTC hit 62K this weekend and the "bottom is in" posts showed up within hours. I'm not buying it.
BTC hit 62K this weekend and the "bottom is in" posts showed up within hours. I'm not buying it.
A sharp low gets announced as a bottom by people who need it to be one. The chart does not care what they need. Here is what the daily structure on BTCUSDT actually says.
Is the BTCUSDT bottom in at 62K?
Not on this count. On the daily I'm counting the decline as wave 3 of a bigger leg down.
The larger picture is a corrective sequence that started from the (5) peak near the top of the chart. Wave (A) finished around the 60K area. After that came a long W-X-Y structure, with the second W-X-Y leg topping out as wave (B) near 88,000. Everything since that top is the next leg lower, labeled 1, 2, 3.
A low in a third wave is not a bottom. It is just where the third wave currently sits.
Why does the drop look like wave 3?
Two things. First, wave 2 failed at the upper channel line. The bounce after the first leg down ran into the descending trendline and rolled over, which is exactly where a second wave should die.
Second, the drop since has been fast. That is what a third wave does. It is usually the most direct and violent leg of the sequence, and the one that convinces people the move is "overdone" while it is still going.
Speed alone does not prove a count. But combined with a rejection at the channel line, it fits an impulse wave better than it fits a one-off flush.
What comes after wave 3?
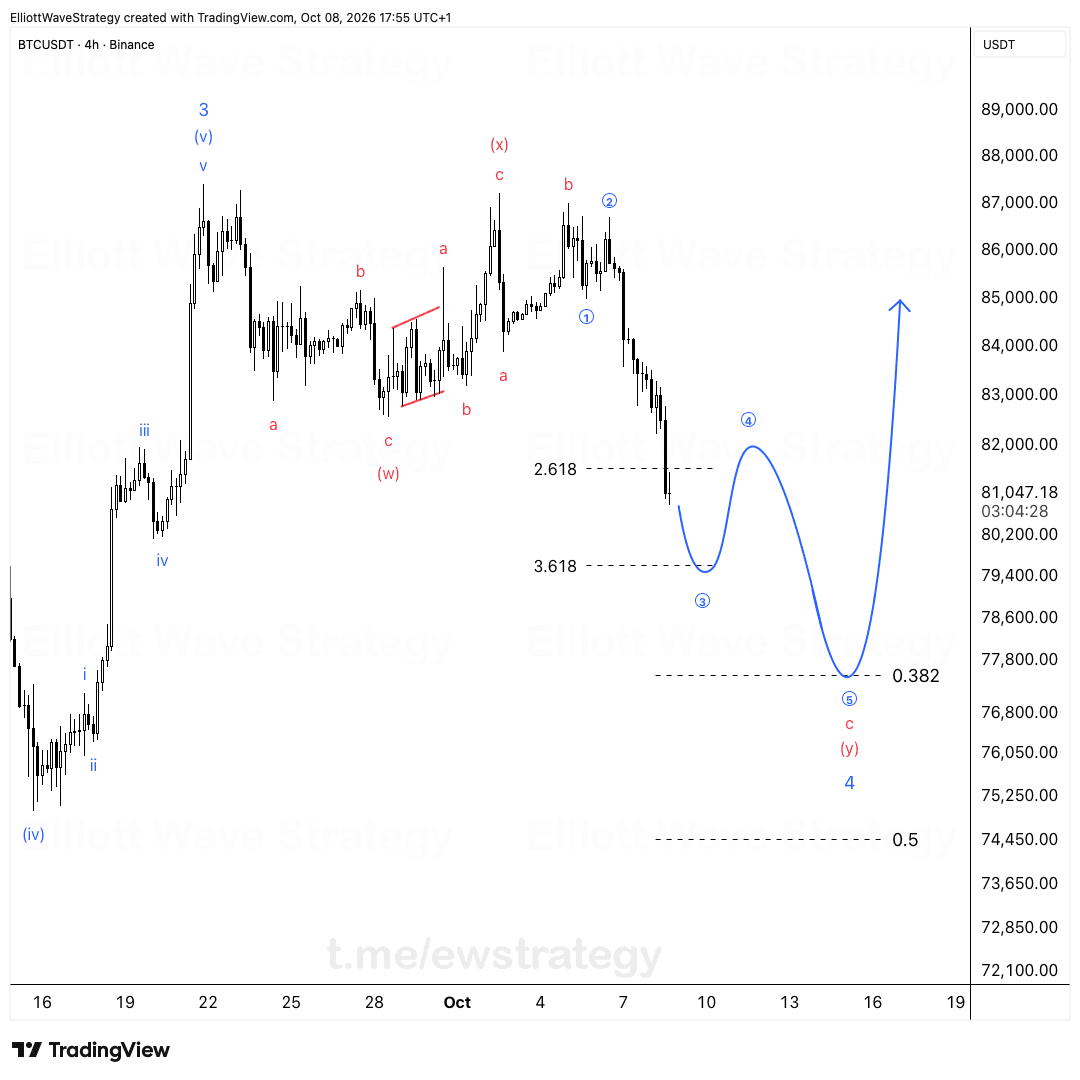
A bounce is likely first. That's wave 4.
The chart shows my drawn path: a rally off the wave 3 low, then another leg down. After the wave 4 bounce I expect lower prices, with wave 5 to follow. The arrow I drew points toward the 49,000 area as the endpoint of that trajectory.
The wave 4 rally is the part that traps people. It will feel like the "I told you the bottom was in" moment. Within this count it is a counter-trend correction inside a larger decline, and it does not change the direction.
What invalidates the bearish BTCUSDT count?
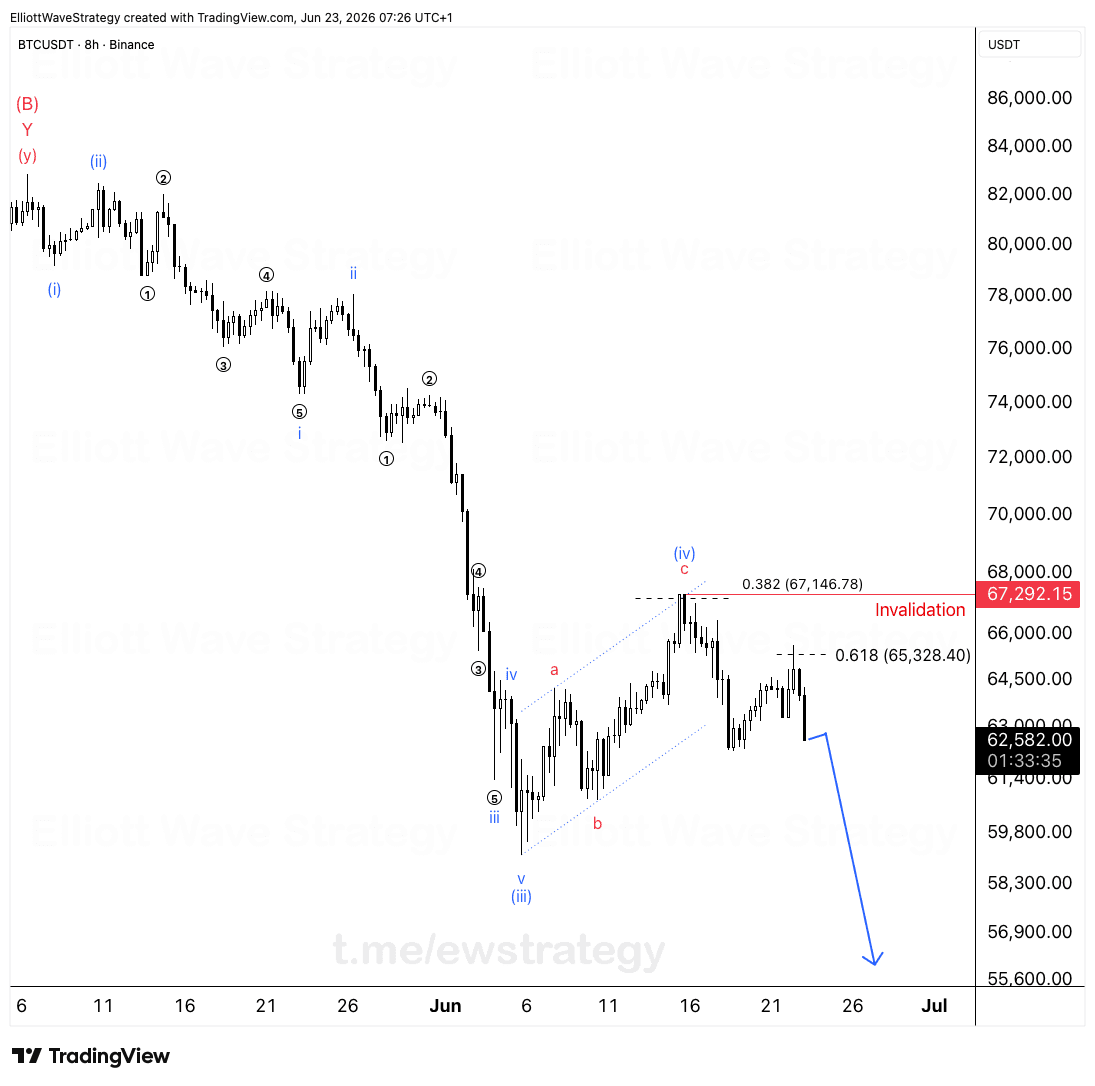
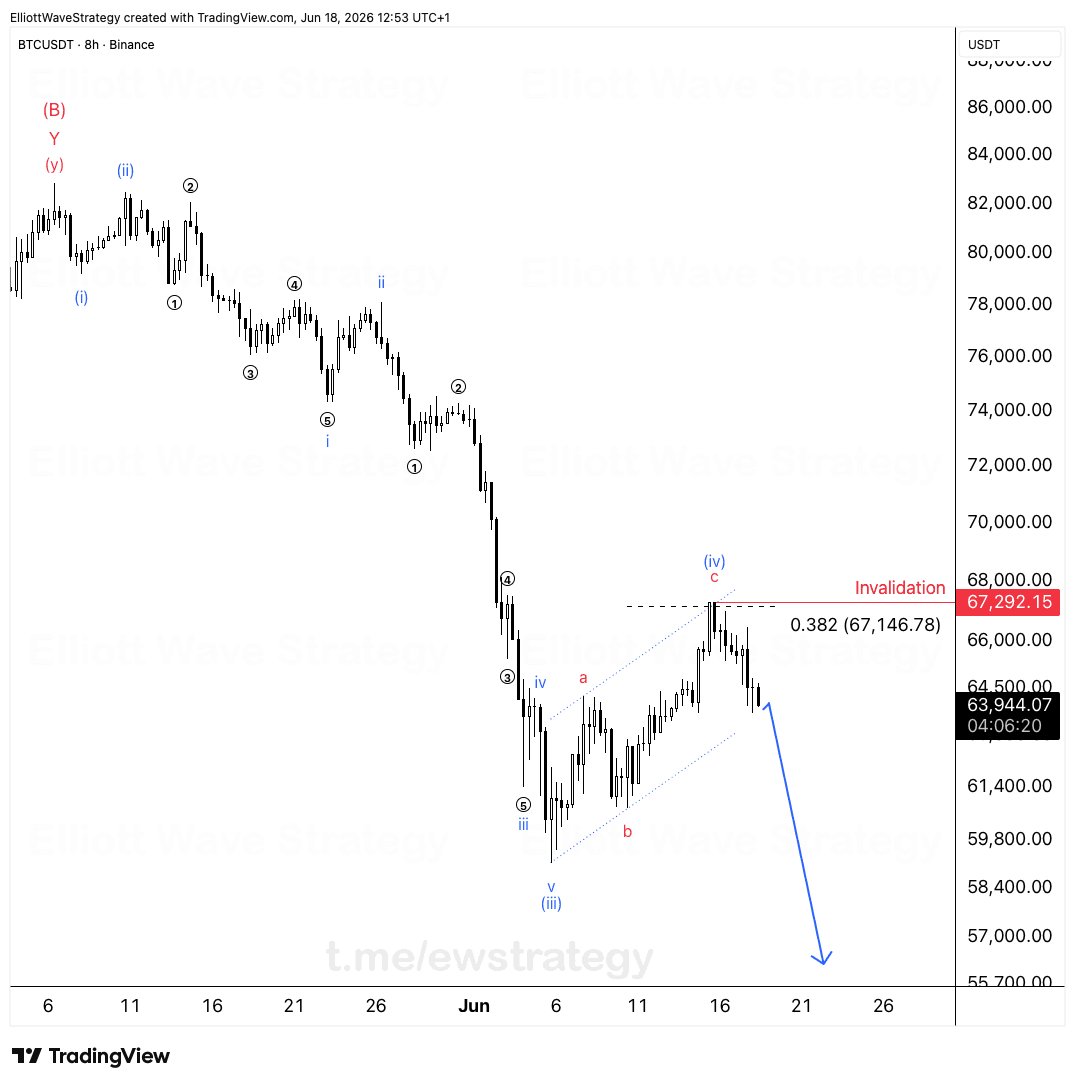
The count is dead above 81,196.
That level is marked on the chart as the invalidation. A move above it would put price back over the wave 2 high and break the idea that wave 3 is in progress. At that point the structure needs to be rebuilt from scratch, not defended.
A clear invalidation is the whole point of having a count. If price proves it wrong, I step aside and re-evaluate. Until then, the structure points lower.
The bottom line
The market does not owe anyone a V-shaped recovery just because a round number got tagged. A fast third wave, a failed wave 2 at the channel line, and a clean invalidation at 81,196 give this count a defined structure. Watch the wave 4 bounce, and watch 81,196.
Key Takeaways
- •BTCUSDT is counted as wave 3 of a larger decline on the daily chart, so the 62K low is treated as a point inside the move rather than a confirmed bottom.
- •Wave 2 in the BTCUSDT count failed at the upper channel line, and the fast drop since fits typical third-wave behavior.
- •A wave 4 bounce is expected first in BTCUSDT, followed by lower prices and a wave 5 leg toward the 49,000 area on the drawn path.
- •The bearish BTCUSDT Elliott Wave count is invalidated by a move above 81,196.
- •Calling a bottom from a single sharp low is a sentiment call, while the Elliott Wave count defines where the structure is wrong.
Frequently Asked Questions
What invalidates the bearish BTCUSDT Elliott Wave count?
A move above 81,196 invalidates it. That level sits above the wave 2 high, and trading through it breaks the idea that wave 3 is in progress.
Why is the BTCUSDT drop counted as wave 3?
Wave 2 failed at the upper channel line and the decline since has been fast. Third waves are typically the most direct leg of an impulse, which matches this behavior.
What comes after wave 3 in the BTCUSDT count?
A bounce labeled wave 4 is likely next, followed by another leg lower as wave 5. The drawn trajectory points toward the 49,000 area.
Disclaimer: This analysis is for educational purposes only and does not constitute financial advice. Elliott Wave analysis involves subjective interpretation. Always do your own research and manage your risk accordingly.
Get Full Coverage for All 27 Instruments
Premium members receive daily wave counts with entry zones, targets and invalidation levels, published daily across all 27 instruments.
View Premium Plans