DXY Elliott Wave: WXY Correction Done, Dollar Set to Turn
We've been saying it for weeks. The dollar isn't done.
We've been saying it for weeks. The dollar isn't done.
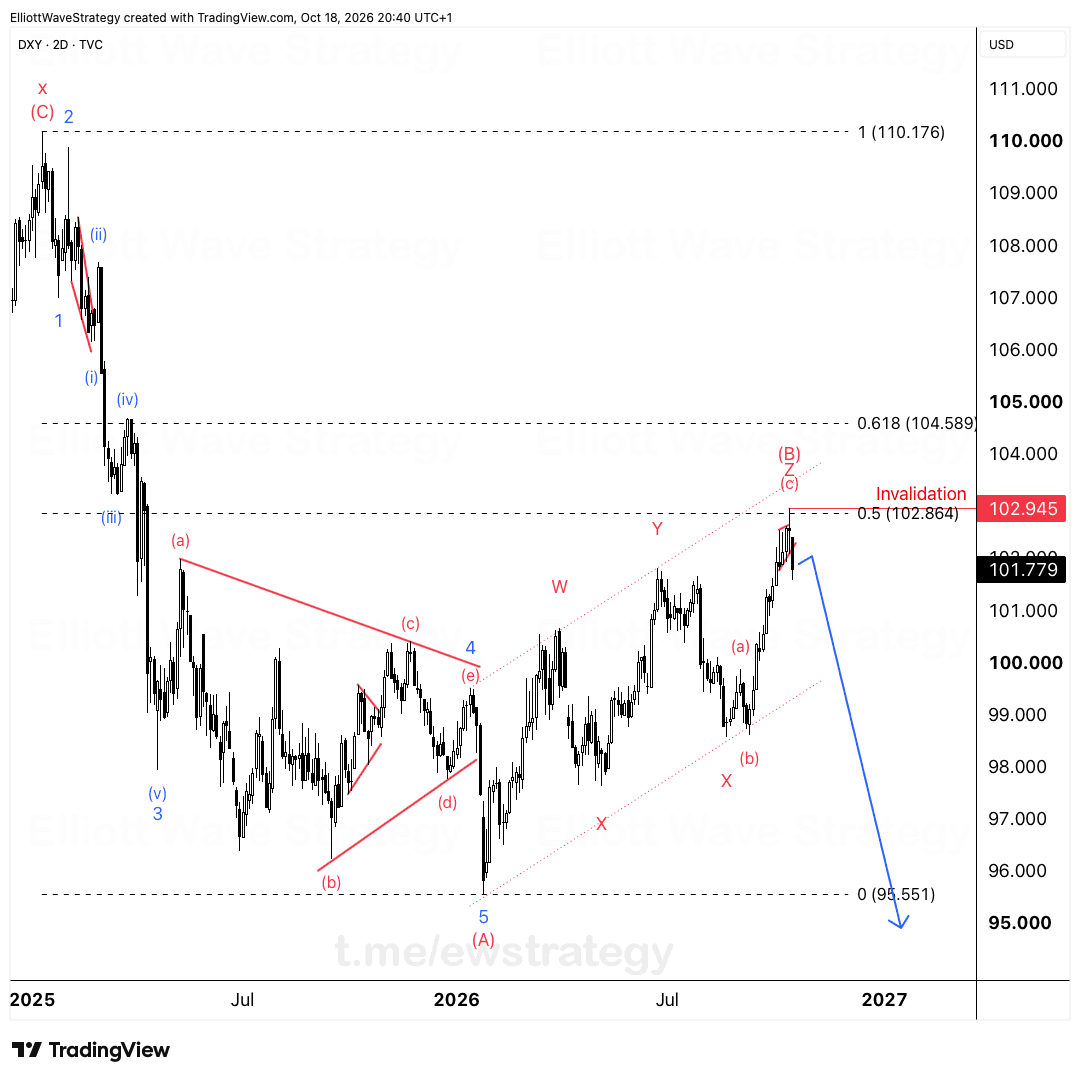
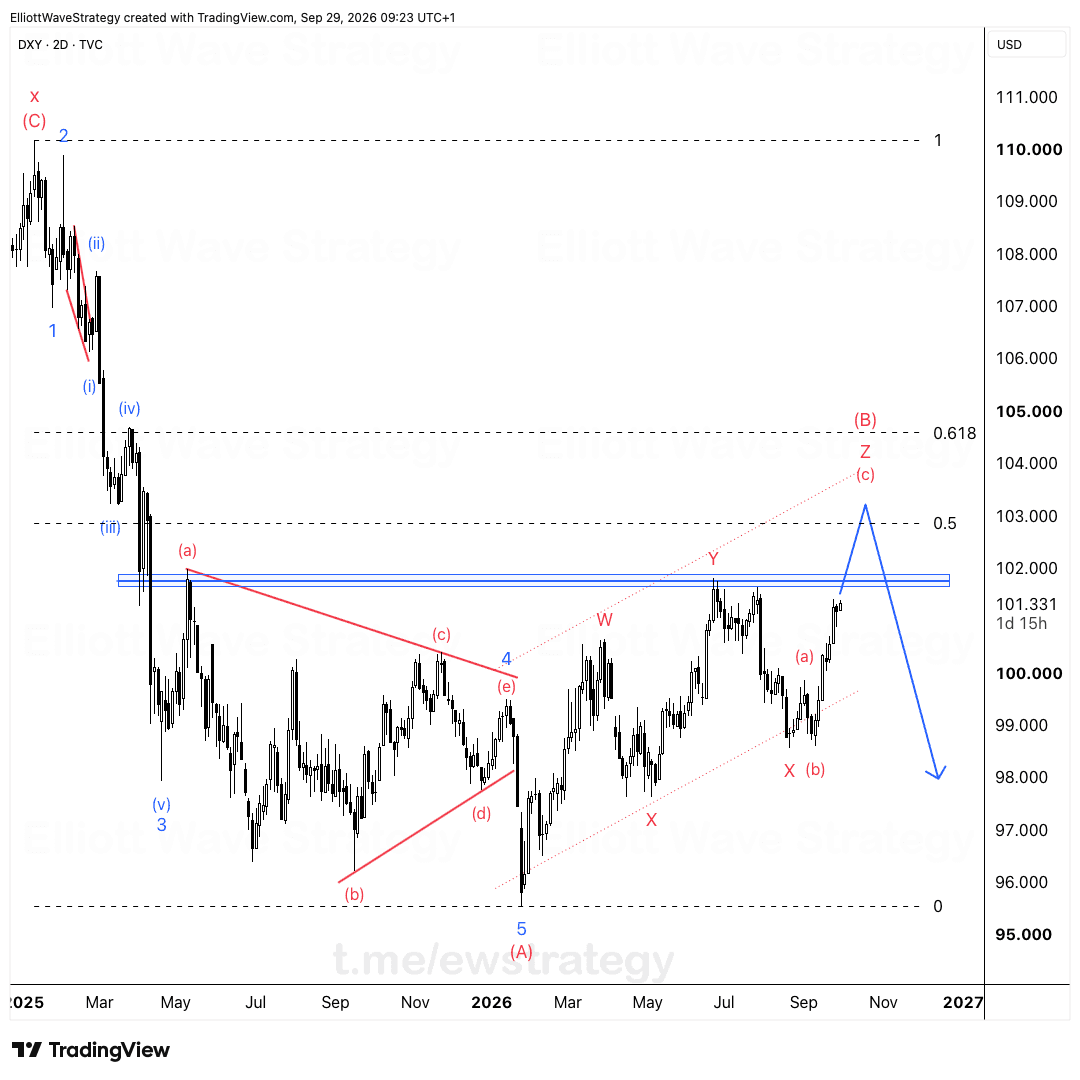
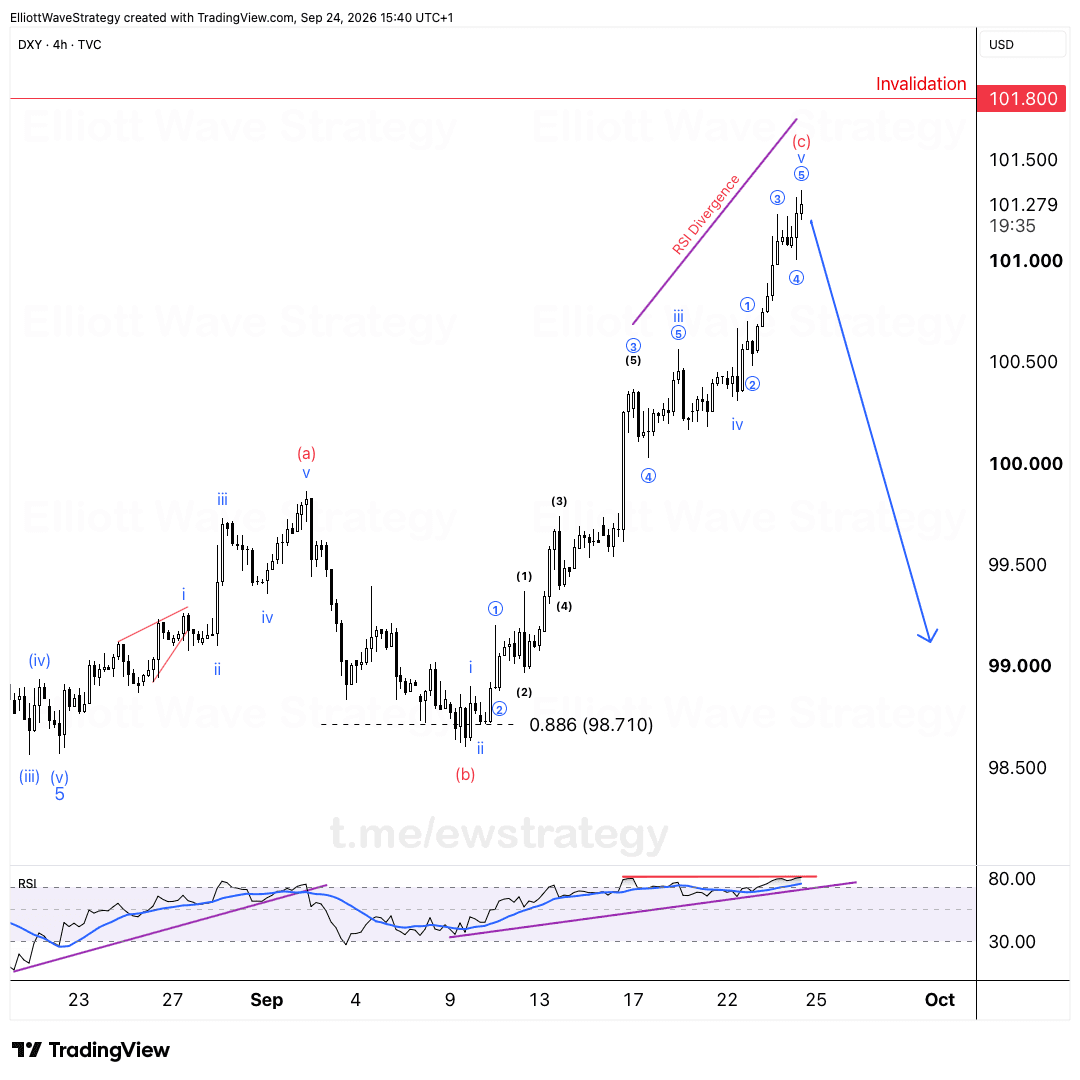
The DXY chart shows wave (ii) unfolding as a WXY correction, and that correction is complete. The descending resistance line that capped price since wave (i) has broken. That break is not decoration, it is confirmation that wave 2 of the larger degree has finished its work.
Invalidation sits at 100.353, right below the wave (ii) low. Hold that level and the next leg higher in DXY is already starting.
What does the WXY structure on DXY actually show?
Look at the internal labels. Wave (i) topped, then the correction ran through a zigzag W, a triangle-like X wave, and a final Y leg down into the (ii) low. Inside that Y wave you can see A, B, C dropping into a small ending diagonal near the 100.353 zone. That is a textbook three-wave WXY combination, not a fresh impulsive decline. Combinations like this exist to eat time and chop up sentiment, not to build new downtrends.
The descending trendline connecting the (i) high through the B and X wave highs held for weeks. Price finally closed above it. A trendline break after a multi-leg corrective structure is one of the cleaner signals in Elliott Wave work, because it shows the corrective pattern has exhausted its supply of sellers.
Why does 100.353 matter so much right now?
That number is the invalidation level for the entire bullish count. It sits just under the low of wave (ii), below the final C wave of the Y leg. As long as DXY stays above it, the larger degree wave count stays intact: wave 1 up, wave 2 down as WXY, and now wave 3 beginning.
A break below 100.353 would not just dent the bullish case, it would erase the reason for calling wave (ii) finished at all. That is why this level gets called out directly on the chart instead of being buried in commentary. Traders watching DXY don't need a vague zone, they need the price that breaks the whole idea.
What does a DXY wave 3 mean for the rest of the board?
One chart, one direction. The whole board follows.
If DXY is starting a third wave higher, the dollar side of every major pair matters. EURUSD, GBPUSD, AUDUSD and gold all sit on the other side of dollar strength, so pressure lower is the expectation there. USDJPY, USDCAD and USDCHF have the dollar working for them instead of against them, so wind at their back is the read.
This is not eight separate stories. It is one dollar structure that dictates direction across correlated pairs and gold at the same time.
The bigger picture
The same view has been repeated here for weeks, and the market keeps confirming it rather than contradicting it. A finished WXY, a broken trendline, and a clean invalidation level at 100.353 make the wave 3 case straightforward to track. This is what a wave count is supposed to give a trader: a level to watch and a direction to expect, one step ahead instead of one step behind.
Key Takeaways
- •DXY has completed a WXY correction for wave (ii), with the descending resistance trendline already broken.
- •The invalidation level for the bullish DXY count is 100.353, just below the wave (ii) low.
- •A new wave 3 higher in DXY would put EURUSD, GBPUSD, AUDUSD and gold under pressure.
- •USDJPY, USDCAD and USDCHF stand to benefit if DXY starts a fresh impulsive leg higher.
- •The DXY Elliott Wave structure treats the recent decline as corrective, not the start of a new downtrend.
Frequently Asked Questions
What invalidates the bullish DXY Elliott Wave count?
A close below 100.353, which sits under the wave (ii) low, would invalidate the current bullish wave count on DXY.
What wave pattern is DXY's wave (ii) correction?
Wave (ii) on DXY formed as a WXY combination, a three-part corrective structure made of a zigzag, an X wave, and a final Y leg down.
How does the DXY count affect EURUSD and gold?
If DXY is starting wave 3 higher, EURUSD, GBPUSD, AUDUSD and gold are expected to face downward pressure since they move inversely to the dollar.
Disclaimer: This analysis is for educational purposes only and does not constitute financial advice. Elliott Wave analysis involves subjective interpretation. Always do your own research and manage your risk accordingly.
Get Full Coverage for All 27 Instruments
Premium members receive daily wave counts with entry zones, targets and invalidation levels, published daily across all 27 instruments.
View Premium Plans