DXY Elliott Wave: Triangle Done, Wave 5 Targets 100.00
The Triangle is complete. The path to $100 is officially open.
The triangle is complete. The path to 100.000 on the Dollar Index is officially open.
For days, DXY chopped sideways in a five-legged A-B-C-D-E structure. Anyone watching price alone would have called it dead, directionless, boring. It wasn't. It was a Wave (4) triangle building energy like a coiled spring, and that spring just released.
What does the triangle in Wave (4) tell us?
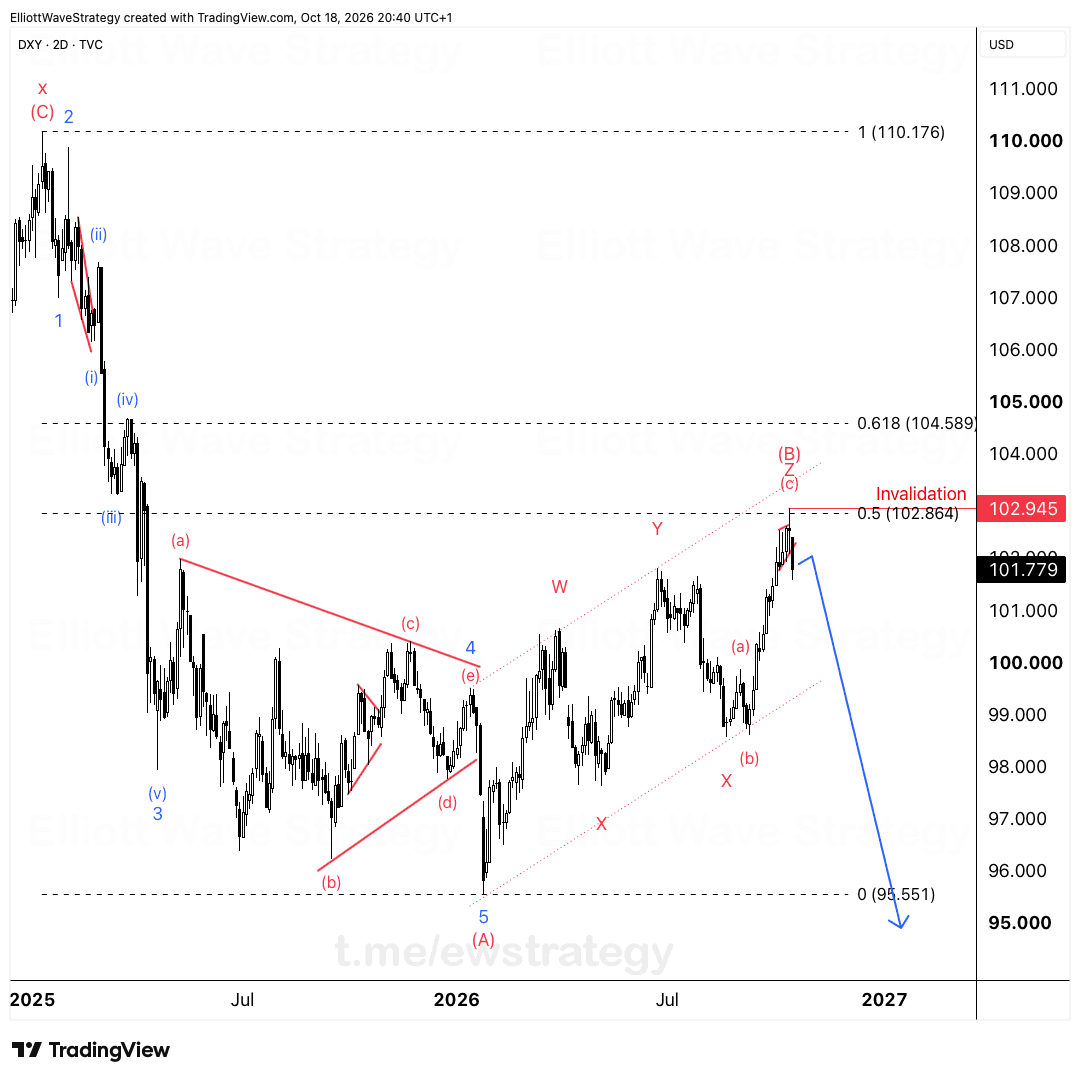
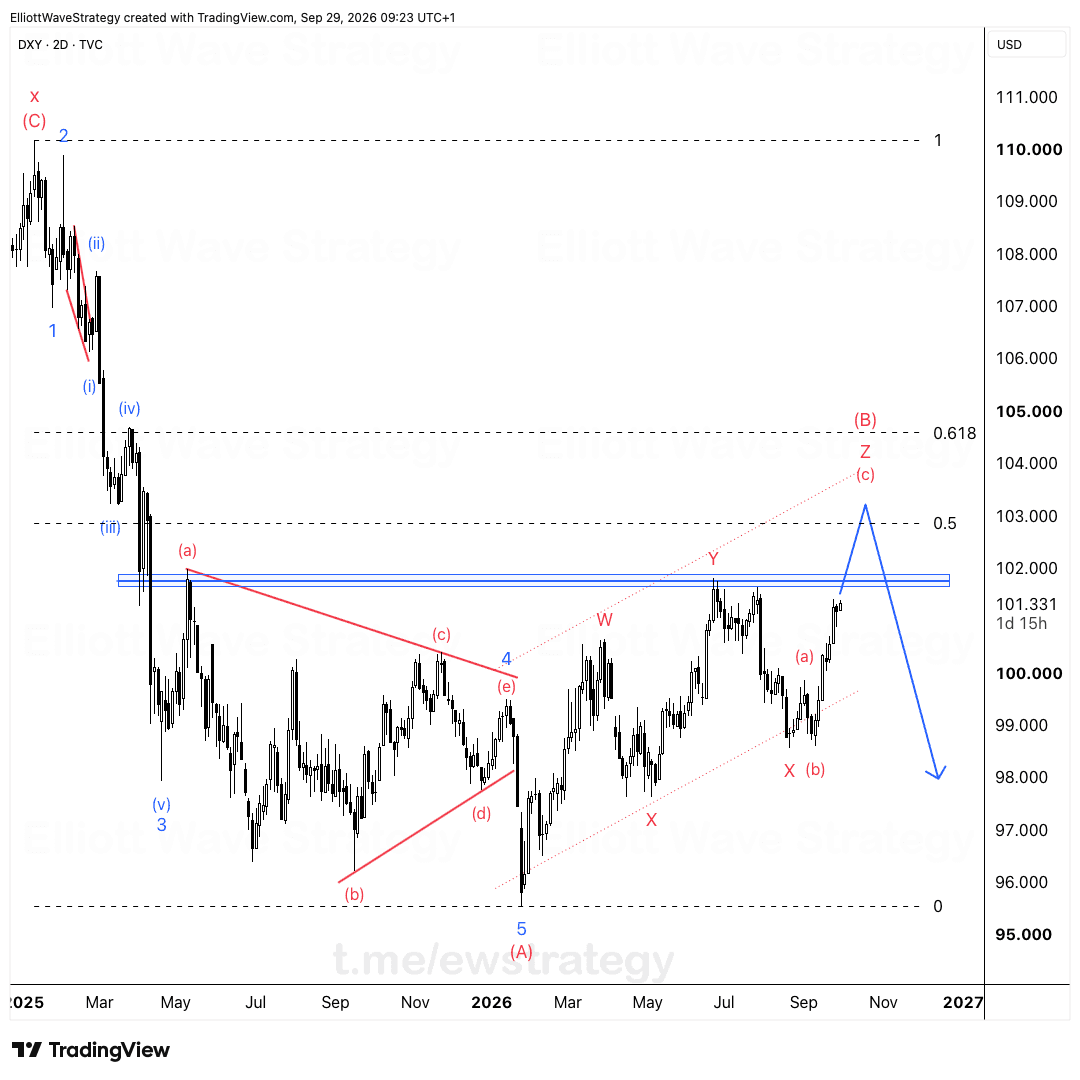
Look at the labeled structure on the chart. Wave (A) down, Wave (B) up, Wave (C) down, Wave (D) up, Wave (E) down. Each leg contracted toward the apex, exactly how a triangle is supposed to behave before the final thrust.
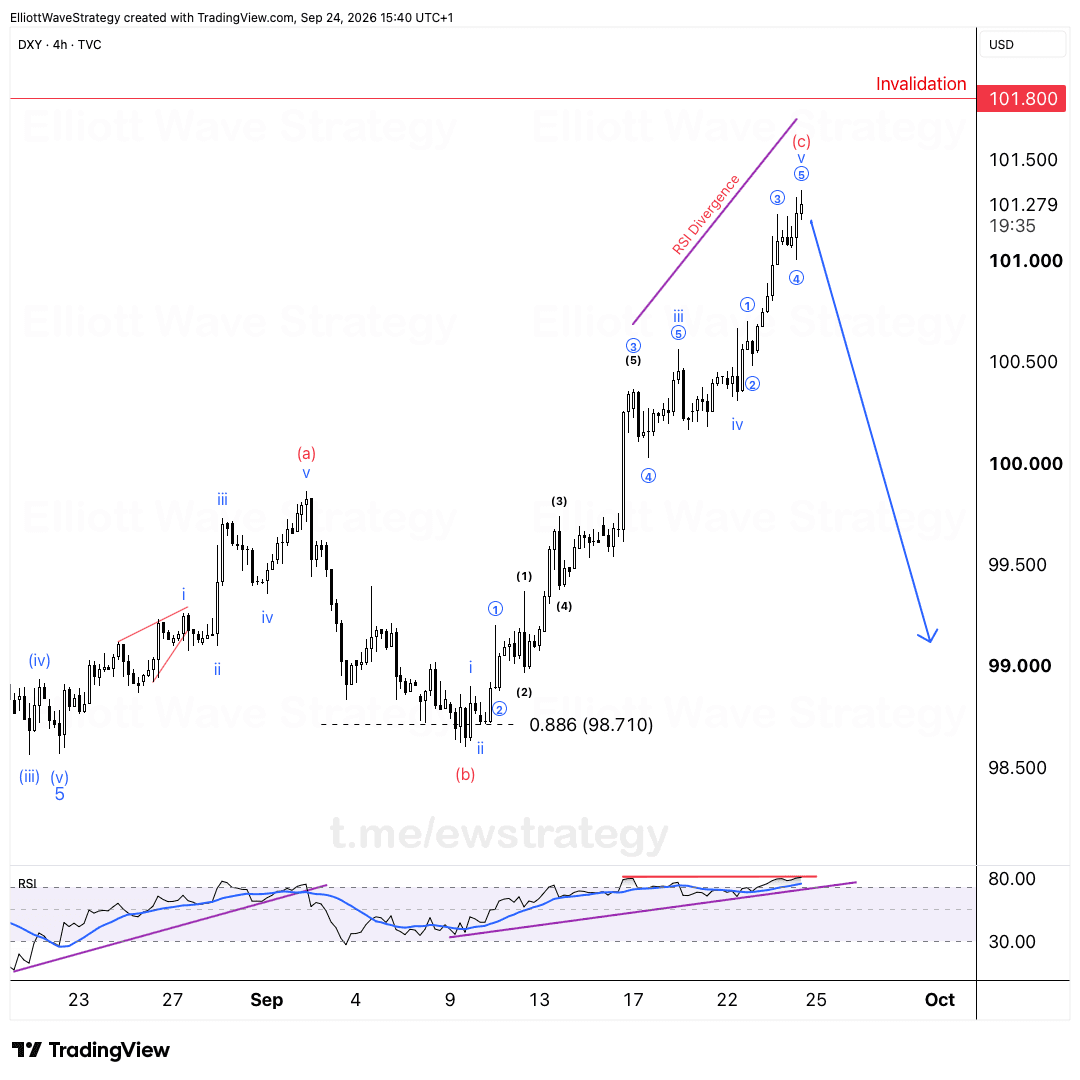
That E-wave low near 98.751 marks the end of the pattern. Triangles in the fourth wave position exist to do one thing: exhaust the countertrend players before the final impulsive leg fires. That's what happened here. Price compressed, sellers got comfortable fading the range, and then the range ran out of room.
Why is Wave (5) pointing to 100.000?
Wave (5) is live now. The blue arrow on the chart shows the projected path straight up toward the 100.000 psychological level, matching where Wave (3) topped near the same structure earlier in the sequence.
This is the final leg of the five-wave impulse that started at the Wave (1) low. Wave (1), (2), (3), (4) are already printed and labeled. Wave (5) is the last piece, and it's the one that tends to attract the crowd late, right when the move is already extended.
The invalidation for this whole structure sits at 98.751. That's the low of Wave (E), and it's marked clearly in red on the chart. As long as DXY holds above that line, the bullish count into 100.000 stays intact. Break below it and the triangle interpretation, along with the Wave (5) target, is off the table.
What does a stronger DXY mean for currency pairs?
This isn't just a Dollar Index story. It's a roadmap for every major pair.
Pairs ending in USD, meaning EURUSD, GBPUSD, AUDUSD, are structurally on the other side of this trade. If DXY is heading up, those pairs face the mirror image: downward pressure.
Pairs starting with USD, meaning USDCAD, USDCHF, USDJPY, move with the dollar. A Wave (5) rally in DXY supports continuation higher in these pairs.
The logic is simple. DXY is a basket, and a basket doesn't move in isolation. When the aggregate is following a clean Elliott Wave impulse, the components tend to follow that same directional bias whether traders notice it or not.
Final read on the setup
The structure here is about as clean as they come: a textbook-shaped triangle in Wave (4), followed by a fifth wave breakout with a hard invalidation level to measure against. Above 98.751, the path to 100.000 remains the primary scenario. Below it, the entire count needs a rethink.
Key Takeaways
- •DXY completed an A-B-C-D-E triangle in the Wave (4) position before starting its current rally.
- •Wave (5) in DXY is projected toward the 100.000 psychological level based on the current Elliott Wave count.
- •The invalidation level for this DXY bullish structure sits at 98.751.
- •A rising DXY implies pressure on USD-quoted pairs like EURUSD, GBPUSD, and AUDUSD.
- •USD-based pairs such as USDCAD, USDCHF, and USDJPY tend to move in line with DXY's Wave (5) direction.
Frequently Asked Questions
What invalidates the bullish DXY Elliott Wave count?
A break below 98.751, the low of Wave (E) in the completed triangle, would invalidate the current Wave (5) bullish structure on DXY.
Why does a triangle appear in the Wave (4) position?
Fourth wave triangles typically form to consolidate and exhaust countertrend traders before a final fifth wave impulse, which is what the A-B-C-D-E pattern on DXY represents.
How does DXY's Wave (5) affect EURUSD and GBPUSD?
Since DXY moving higher generally means the dollar is strengthening, pairs quoted with USD as the second currency, like EURUSD and GBPUSD, tend to face downward pressure during this phase.
Disclaimer: This analysis is for educational purposes only and does not constitute financial advice. Elliott Wave analysis involves subjective interpretation. Always do your own research and manage your risk accordingly.
Get Full Coverage for All 27 Instruments
Premium members receive daily wave counts with entry zones, targets and invalidation levels, published daily across all 27 instruments.
View Premium Plans