DXY Elliott Wave: Is the Dollar Top Already In?
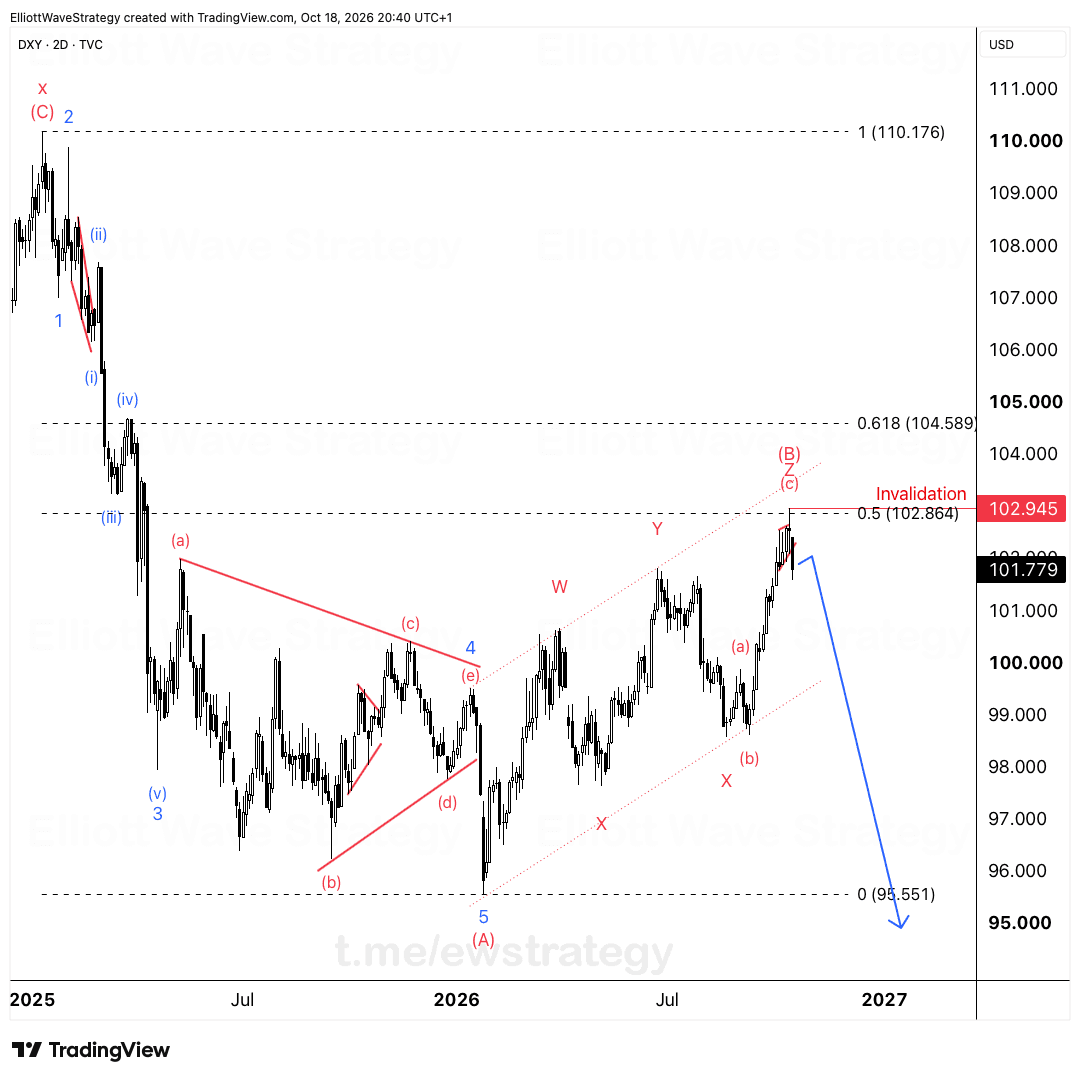
The dollar's rally stalled just under 102.945 and I think the top is in. On the chart that's the end of wave (c) of Z in a larger wave (B), with the high sittin
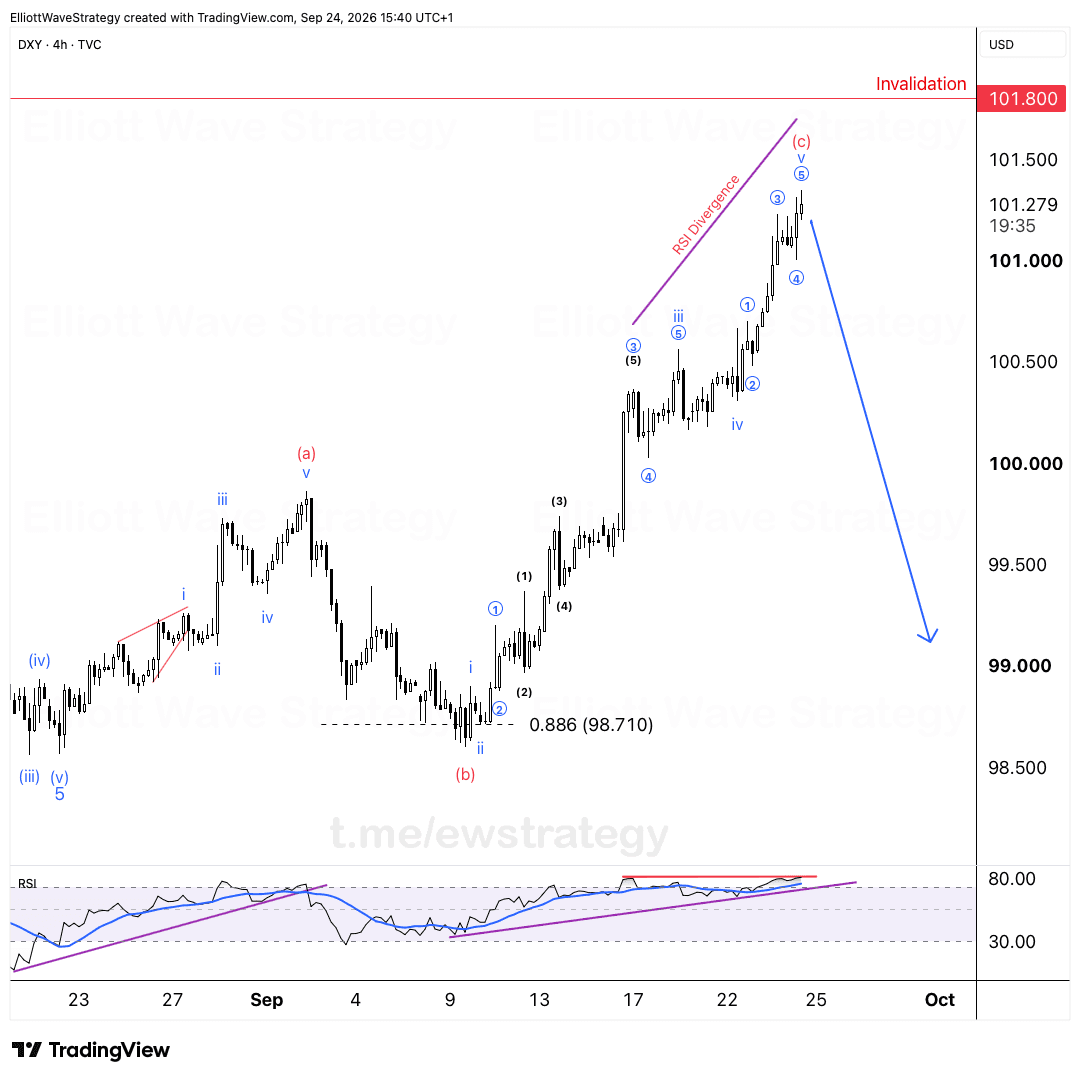
The dollar's rally stalled just under 102.945, and I think the top is in. On the 4-hour chart, that high is the end of wave (c) of Z inside a larger wave (B).
The high sits at 102.864 on the 0.5 retracement. That is where the count says the move should have run out of room.
Why does the DXY count point to a top at 102.864?
The advance from the (b) low near 98.710 is labeled as a five-wave sequence, and it ends with wave v of (c). That makes (c) the closing leg of a Z, the last piece of a complex correction. A correction like that has no business becoming a new trend.
The 98.710 low is the 0.886 retracement, so the structure came off a deep, clean level. The top at the 0.5 retracement of 102.864 gives the other end of the framework. Both ends are measurable, and that is what makes this count testable.
If you want the basics on how a zigzag behaves and why wave B rallies trap people, the wave B glossary entry covers it.
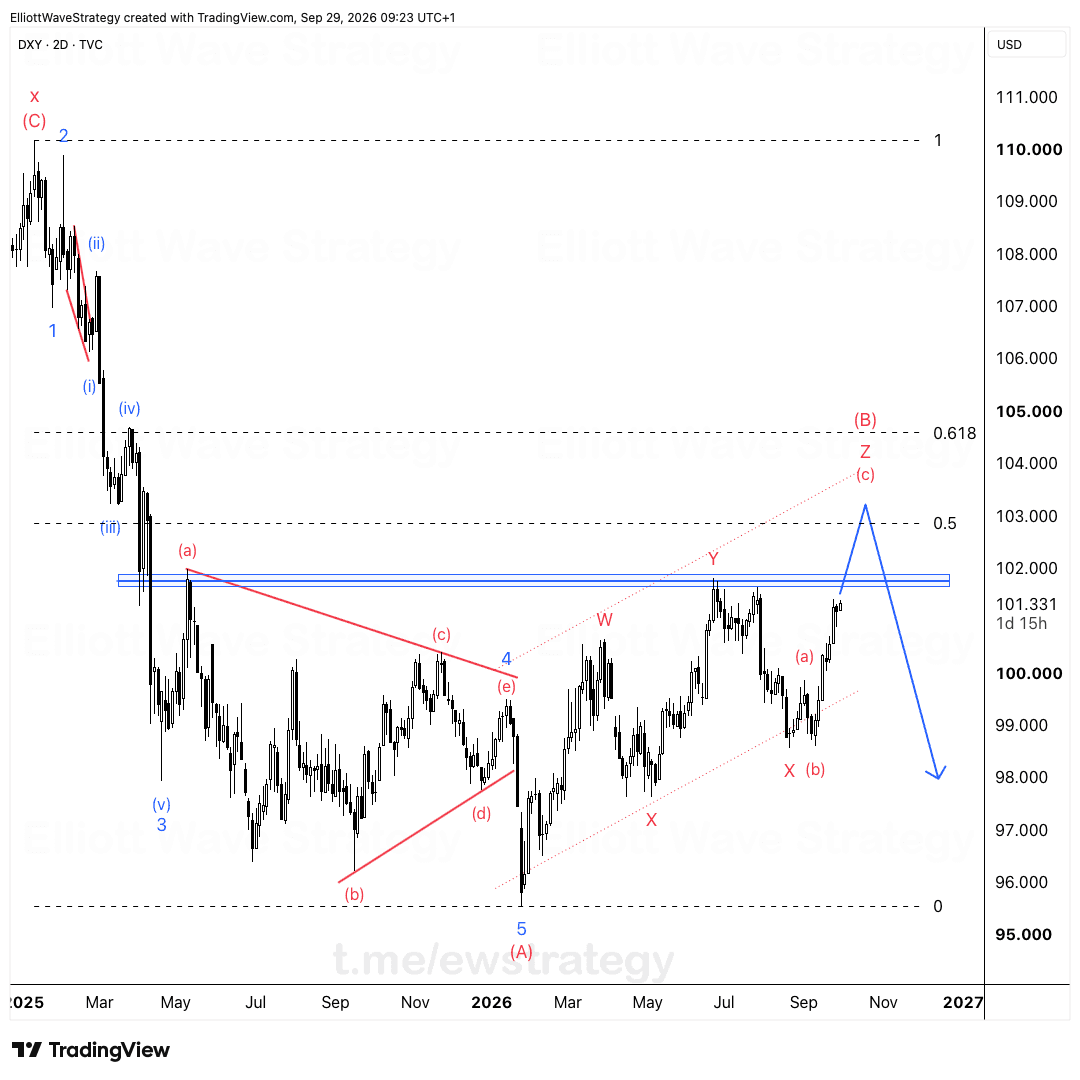
What should DXY do next: a bounce first?
Price has been drifting sideways to slightly up since the drop, so a bounce over the next few days is possible. I would not read that as strength. It is a drift inside a correction.
The zone to watch is 102.195-102.372. That is the 0.5 and 0.618 Fibonacci retracement of the last leg down. I don't expect more than a correction there.
After that, the dollar should resume lower, as the blue arrow on the chart shows. The path is a bounce into the zone, a rejection, then a leg down that carries well below the recent lows.
What invalidates the bearish dollar count?
Above 102.945, this count is off. That is the invalidation level, and it is the actual price, not a vague zone.
This is how Elliott Wave should work. You get a count, you get a line where the count is wrong, and you stop arguing with the market once it crosses. A break above 102.945 means the (B) wave is still extending and the top is not in.
What does a weaker dollar mean for the majors?
If DXY rolls over after the bounce, the pairs react in a predictable way. EURUSD, GBPUSD and AUDUSD should catch a tailwind once the bounce is done. USDJPY, USDCAD and USDCHF come under pressure.
That is a map for your own charts, not a signal. Check each pair's own wave count before you trust the dollar read-through. For how these counts work across currency pairs, see Elliott Wave for forex.
The dollar has a defined top, a defined bounce zone and a defined line where I am wrong. Everything else is noise.
Key Takeaways
- •DXY stalled just under 102.945, and the Elliott Wave count labels that high as the end of wave (c) of Z inside a larger wave (B).
- •The DXY high at 102.864 sits on the 0.5 retracement, which fits the count that the top is already in.
- •A bounce in DXY toward 102.195-102.372, the 0.5 to 0.618 retracement of the last leg down, is expected to be a correction only.
- •The bearish DXY count is invalidated by a move above 102.945.
- •If DXY resumes lower after the bounce, EURUSD, GBPUSD and AUDUSD should catch a tailwind while USDJPY, USDCAD and USDCHF come under pressure.
Frequently Asked Questions
What invalidates the bearish DXY Elliott Wave count?
A move above 102.945 invalidates the count. That level is the high just above the 0.5 retracement at 102.864, and trading above it means wave (B) is still extending.
Where could the DXY bounce stall before moving lower?
The zone to watch is 102.195-102.372, the 0.5 and 0.618 retracement of the last leg down. The expectation is a correction there, not a new rally, followed by a resumption lower.
What does a DXY top mean for EURUSD, GBPUSD and AUDUSD?
If the dollar resumes lower after the bounce, EURUSD, GBPUSD and AUDUSD should catch a tailwind, while USDJPY, USDCAD and USDCHF come under pressure. Each pair still needs its own wave count.
Disclaimer: This analysis is for educational purposes only and does not constitute financial advice. Elliott Wave analysis involves subjective interpretation. Always do your own research and manage your risk accordingly.
Get Full Coverage for All 27 Instruments
Premium members receive daily wave counts with entry zones, targets and invalidation levels, published daily across all 27 instruments.
View Premium Plans