EURUSD Elliott Wave: Wave 5 Done, Pullback to 0.5-0.618 Fib
https://s3.tradingview.com/snapshots/p/pQzi75kf.png
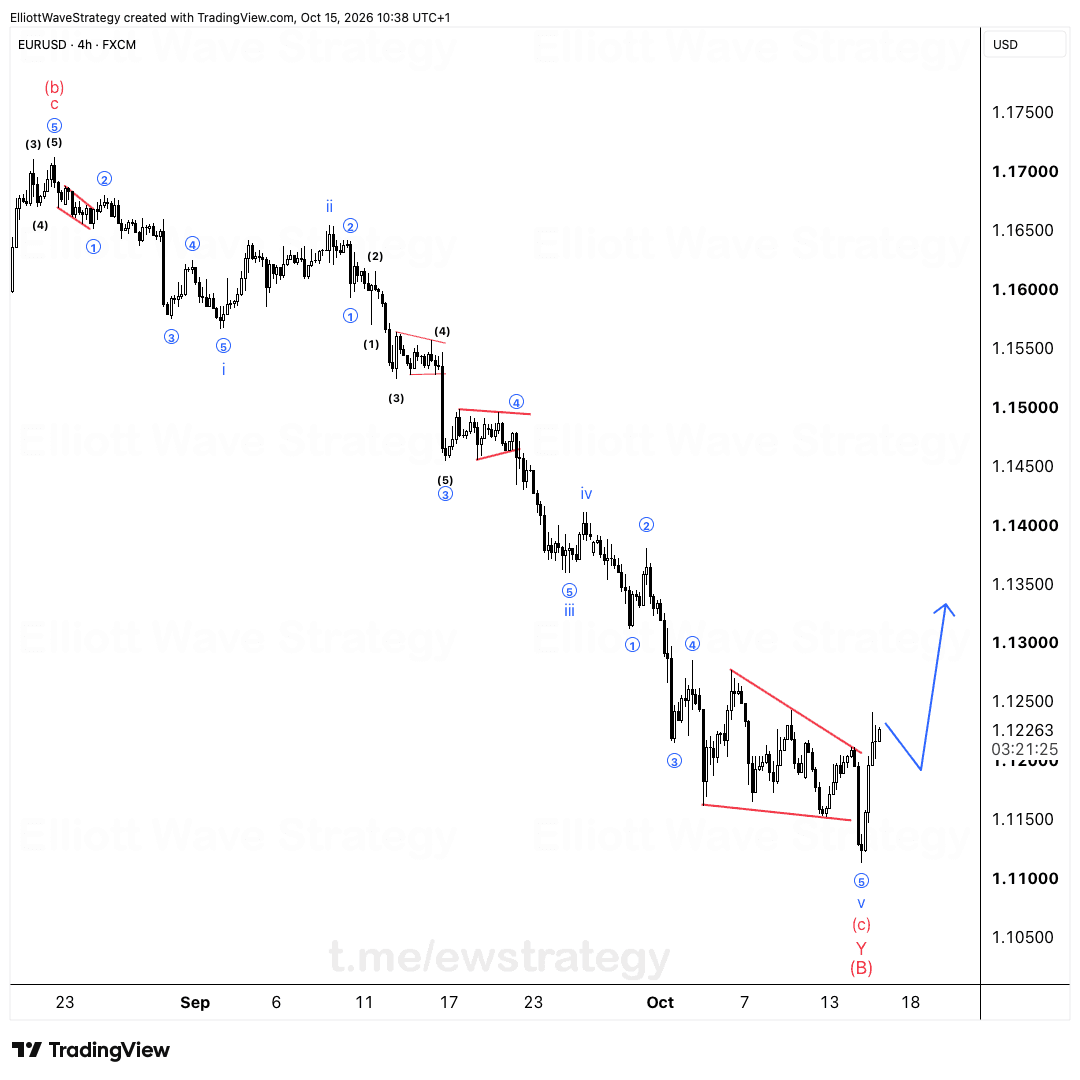
EURUSD just closed out wave (v), completing the 5-wave impulse that ran from wave (i) all the way up through wave 5. The rally is done for now. The bigger trend is not.
That distinction matters more than anything else on this chart. Traders who mix up the two are the ones who end up on the wrong side of the next leg higher.
Why is EURUSD pulling back after wave (v)?
A finished 5-wave impulse does not mean the trend is over. It means the move higher, from wave 3, through the (w)-(x)-(y) correction into wave 4, and up through the (i) through (v) sequence, has run its course for this stage. Structure like this needs a correction before the next advance.
That's exactly what is happening now. Price has dropped off the wave 5 high and is working lower. This is the market unwinding the impulse, not reversing it.
What does the amateur trader get wrong here?
This is exactly when amateur traders panic and start calling for a reversal. That's the wrong move.
Every finished impulse produces a pullback. Untrained eyes see red candles after a rally and assume the top is in. Experienced Elliott Wave traders see a corrective wave doing its job, nothing more.
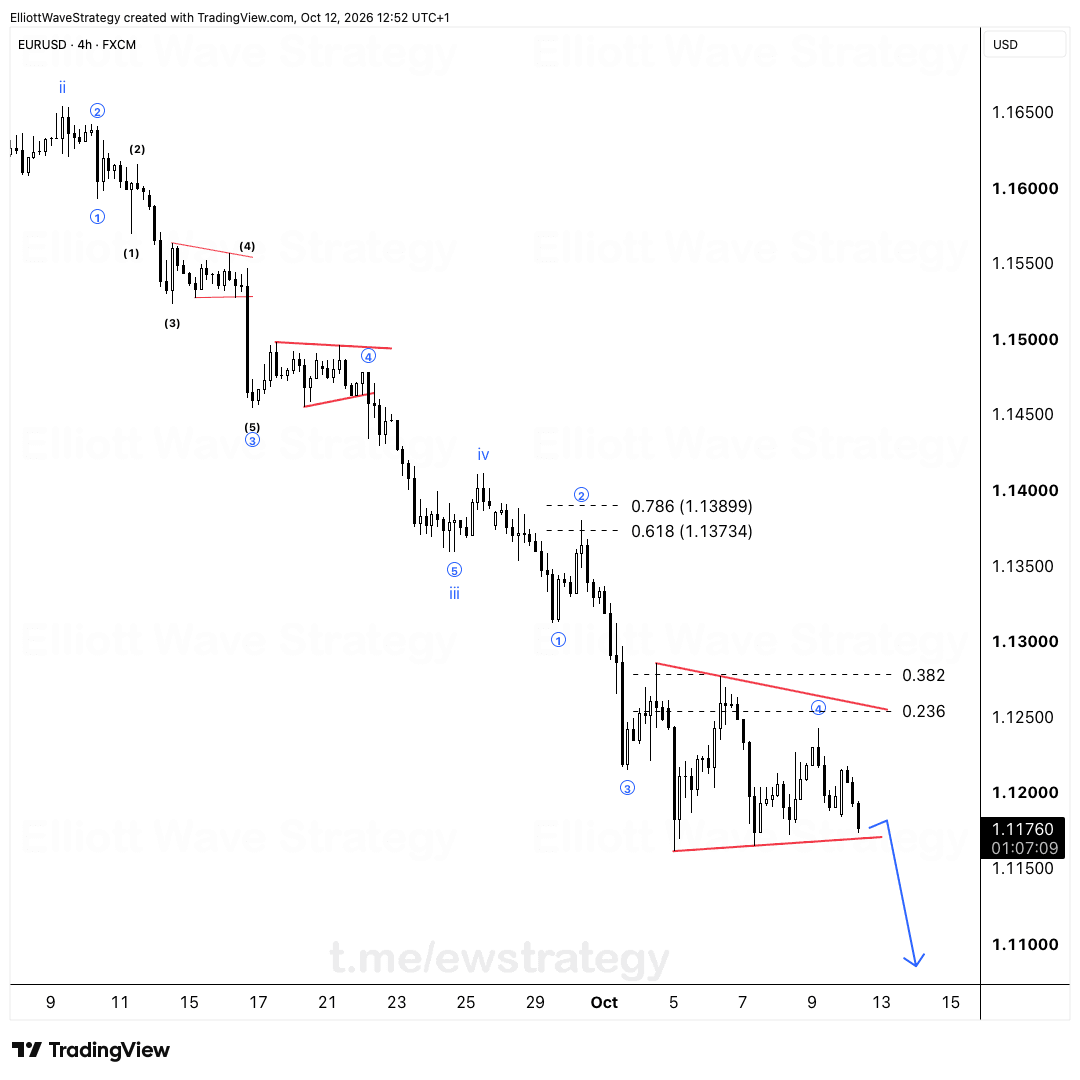
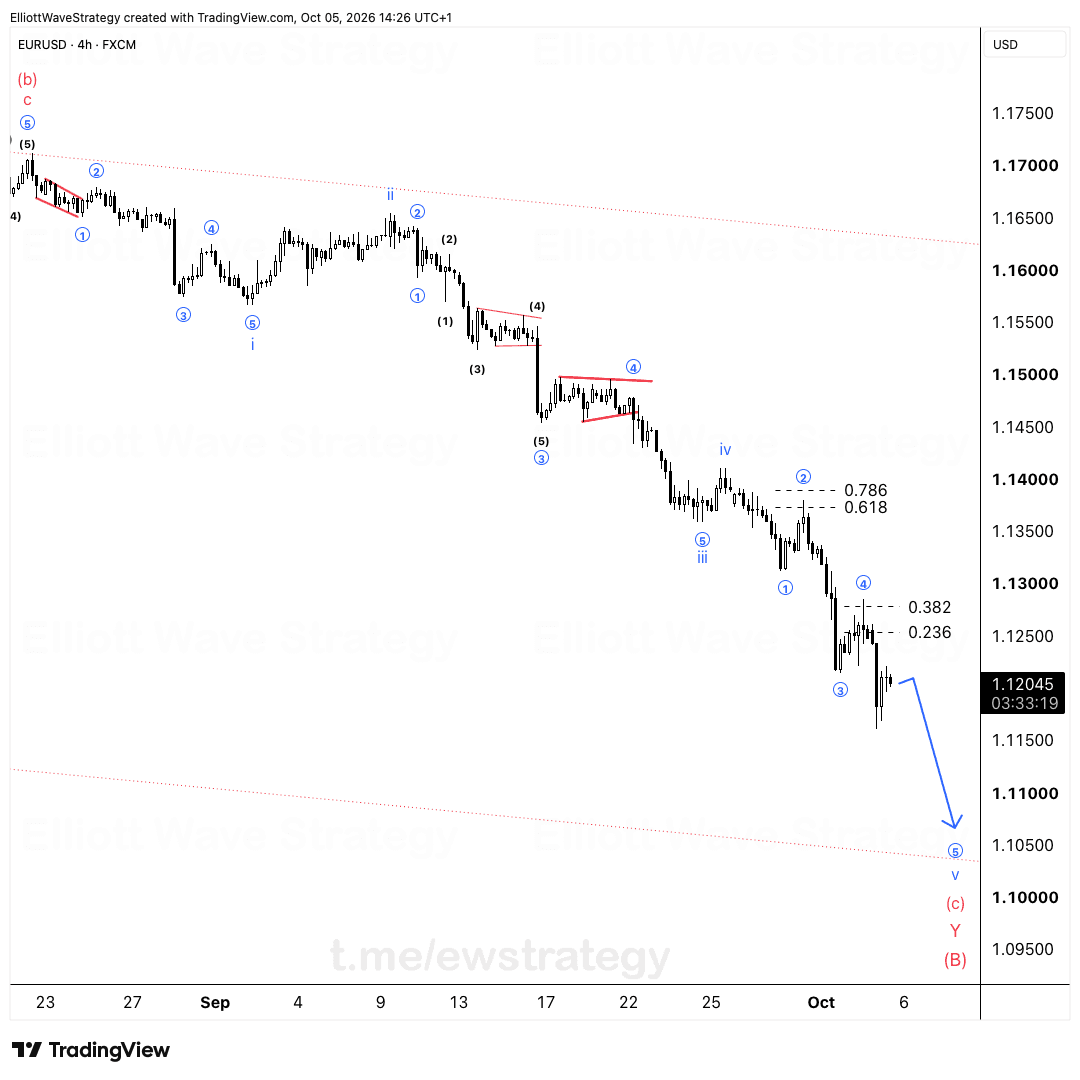
The EURUSD chart shows the wave 5 high already printed and a corrective leg forming right after it. That's structure behaving normally, not breaking down.
Where is the EURUSD pullback expected to land?
The 0.5 to 0.618 Fibonacci retracement zone is where this correction is expected to find its floor. On the chart, that box sits between roughly 1.150 and 1.150, right where the projected path curls back upward.
This zone is where buyers are expected to step back in and load up for the next leg higher. It's a classic retracement area for a corrective wave following a completed impulse, not a random guess.
The drawn arrow on the chart shows the expected path: down into the 0.5-0.618 zone, then a turn back up toward new highs above the wave 5 print.
Is there a trade here right now?
No entry yet. Structure has to come to us first.
That means waiting for price to actually reach the 0.5-0.618 zone and show signs of the correction completing before treating this as anything actionable. The plan is built, but the market hasn't delivered the setup.
Until EURUSD prints a clean corrective structure into that Fibonacci zone, this remains a chart to watch, not a chart to trade.
The bigger picture stays intact as long as this pullback behaves like a correction and not an impulsive move against the prior trend. Patience with the structure is what separates this read from the panic calls flying around after every finished 5-wave move.
Key Takeaways
- •EURUSD completed a 5-wave impulse with wave (v), meaning the rally phase is finished but the larger uptrend is not.
- •The EURUSD pullback is expected to land in the 0.5 to 0.618 Fibonacci retracement zone before buyers step back in.
- •Calling for a reversal right after a completed impulse is a common mistake; this move fits the profile of a normal correction.
- •No EURUSD entry is being considered until price reaches the Fib zone and structure confirms the correction is complete.
- •The next leg higher on EURUSD is expected to develop once the corrective pullback finishes inside the 0.5-0.618 zone.
Frequently Asked Questions
Why did EURUSD drop after wave 5?
Wave 5 completed the 5-wave impulse from wave (i), and a corrective pullback naturally follows a finished impulse. This does not signal a trend reversal, just a normal correction.
Where is the EURUSD pullback expected to end?
The 0.5 to 0.618 Fibonacci retracement zone is the area being watched for the correction to find support before the next leg higher.
Is this pullback a sell signal for EURUSD?
No. The analysis treats this as a corrective phase within a larger uptrend, and no entry is being considered until price reaches the Fibonacci zone and confirms the structure.
Disclaimer: This analysis is for educational purposes only and does not constitute financial advice. Elliott Wave analysis involves subjective interpretation. Always do your own research and manage your risk accordingly.
Get Full Coverage for All 27 Instruments
Premium members receive daily wave counts with entry zones, targets and invalidation levels, published daily across all 27 instruments.
View Premium Plans