GBPJPY Elliott Wave: Why Daily Bias Rules the 4H Chart
This is why we start with the Daily chart.
This is why we start with the Daily chart.
At the beginning of the week, we shared the GBPJPY Daily analysis, mapping the larger correction and the levels to watch. A few days later, the 4H chart shows how that structure is developing. This is the whole point of top down analysis: the higher timeframe gives you the bias, the lower timeframe shows you how price actually gets there.
What happened at the 0.786 retracement on GBPJPY
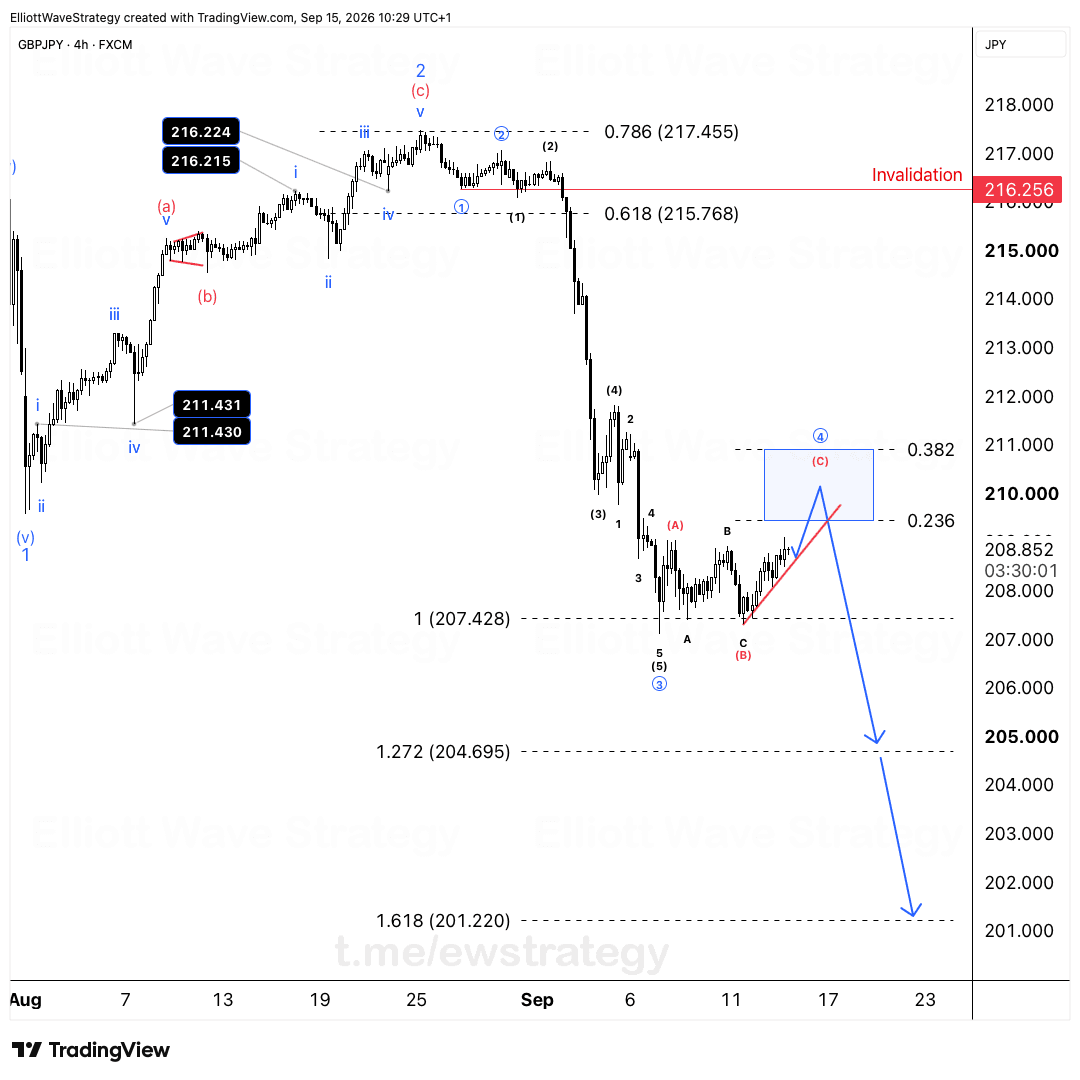
Wave 2 (c) pushed into the 0.786 retracement at 217.455 and got rejected there. Before that, price had already tagged the 0.618 zone at 215.768 on the way up. Both levels are marked on the 4H chart, and both did their job as resistance for the corrective rally inside wave 2 (c) of the larger structure.
The internal count into that high is labeled i through v in blue, with wave iii peaking right at the 0.786 line before wave iv pulled back to 216.224 and wave v made the final push. That's a clean five wave move up into resistance, which is exactly what you want to see if the whole thing is a corrective wave 2 rather than a new impulse.
Why the drop from 217.455 matters for the larger count
The impulse down from the 217.455 rejection is what confirms the bigger picture. Cetin's post is direct about it: this decline is unfolding in five waves, and that structure is what confirms the larger degree Wave 1 low near 207.428 still holds.
In Elliott Wave terms, a five wave decline out of a corrective high is the market telling you the trend that produced Wave 1 down is still active. If this were just a random pullback, you wouldn't expect a five wave impulsive structure to follow it. The fact that it's showing up on the 4H chart, right after the rejection at 215.768 and 217.455, is the confirmation.
How the Daily and 4H charts work together here
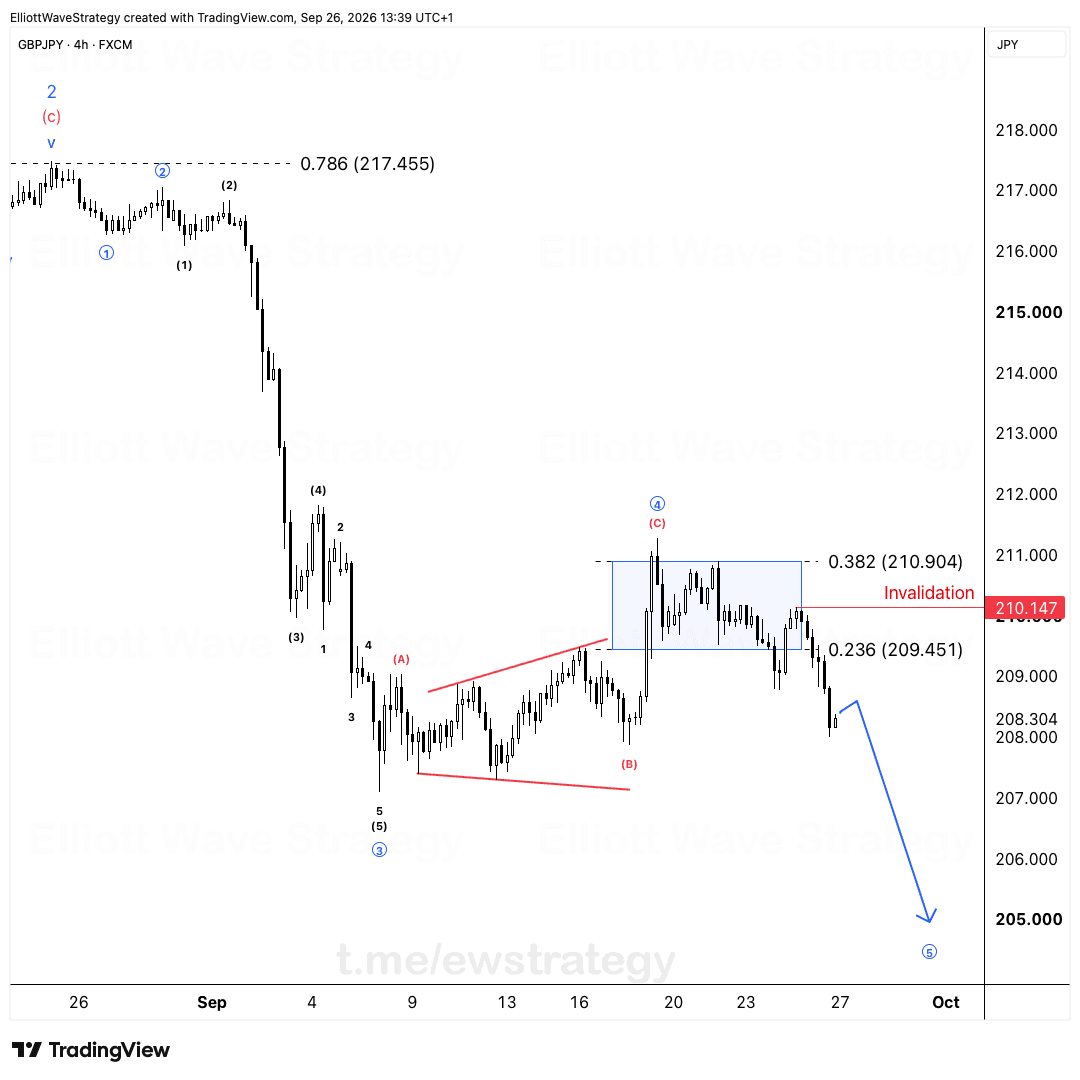
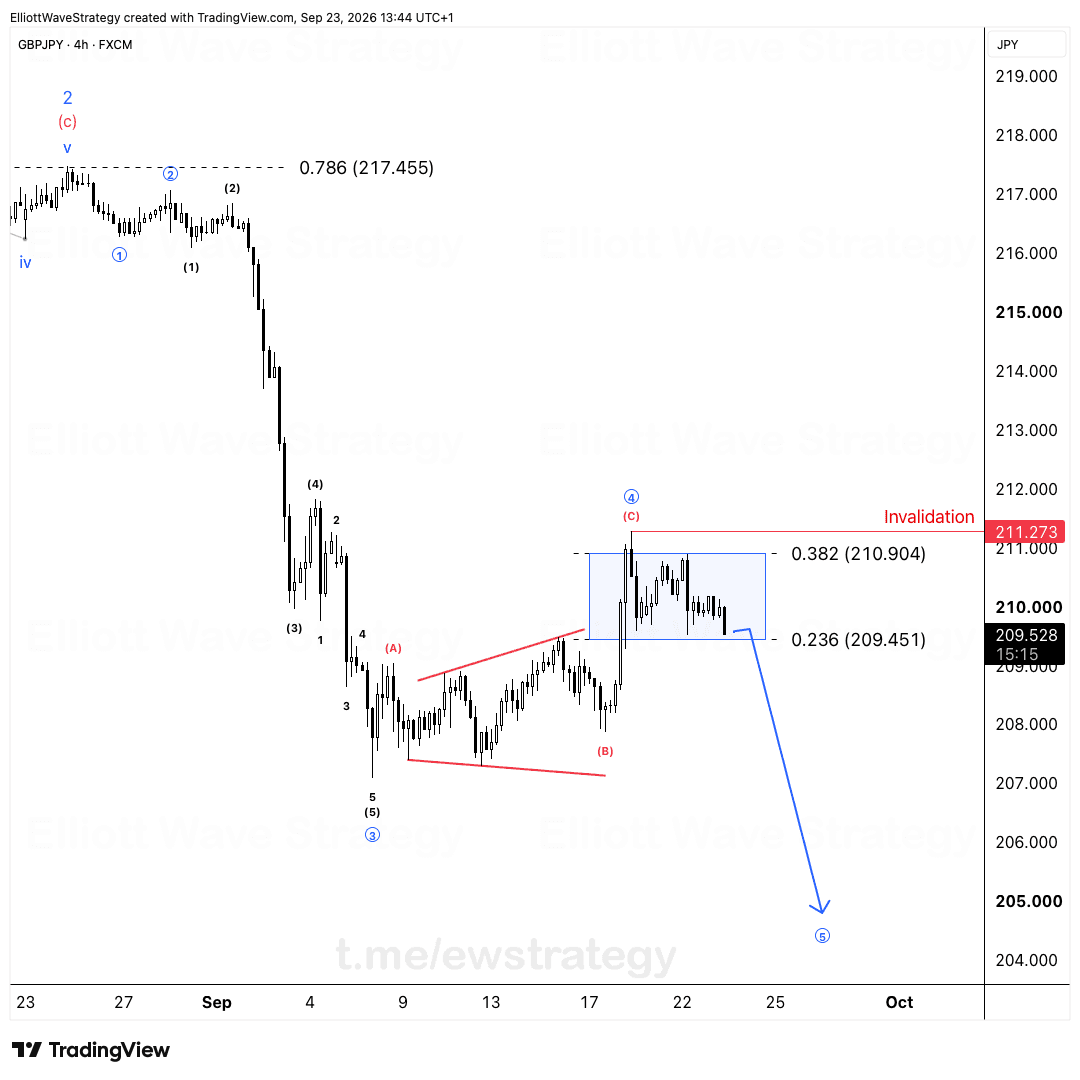
The Daily chart gives you the big structure: the larger correction, the degree labeling, the invalidation zone. The 4H chart is where you watch that structure actually play out, wave by wave, candle by candle.
That's the discipline behind this whole GBPJPY setup. You don't trade the 4H chart in isolation and hope it lines up with the bigger trend. You start with the Daily bias, in this case a correction that should eventually resolve back toward the Wave 1 low, and then you use the 4H to refine the count and see whether price is behaving the way that bias predicts.
The extension level at 204.695, marked as the 1.272 projection on the chart, sits below the 207.428 Wave 1 low. If the five wave decline from 217.455 keeps developing the way it's labeled, that lower zone becomes the next area to watch as the structure extends.
Daily bias first, 4H confirmation second. That order doesn't change just because the lower timeframe chart looks busy.
Key Takeaways
- •GBPJPY rejected the 0.786 retracement at 217.455 after tagging the 0.618 zone at 215.768 during wave 2 (c).
- •The decline from the 217.455 high on GBPJPY is developing in five waves, which supports the larger corrective structure staying intact.
- •The Wave 1 low near 207.428 remains the reference level that the current five wave decline is confirming.
- •The 1.272 extension at 204.695 is the next zone in view if the GBPJPY impulse down keeps developing as labeled.
- •Top down analysis on GBPJPY means using the Daily chart for structure and the 4H chart to track how that structure plays out.
Frequently Asked Questions
What confirmed the GBPJPY wave 2 rejection at 217.455?
Price tagged the 0.786 Fibonacci retracement at 217.455 after already reaching the 0.618 zone at 215.768, then reversed into a five wave decline, which is the behavior expected from a completing corrective wave rather than a new impulsive leg up.
Why does the five wave decline matter for the GBPJPY count?
A five wave impulsive structure moving down from the wave 2 (c) high supports the idea that the larger downtrend, and the Wave 1 low near 207.428, is still the dominant structure rather than being replaced by a new bullish trend.
How should traders use the Daily and 4H GBPJPY charts together?
The Daily chart sets the larger degree bias and the levels that matter, while the 4H chart is used to follow the move in more detail and check whether price action matches what the Daily structure predicts.
Disclaimer: This analysis is for educational purposes only and does not constitute financial advice. Elliott Wave analysis involves subjective interpretation. Always do your own research and manage your risk accordingly.
Get Full Coverage for All 27 Instruments
Premium members receive daily wave counts with entry zones, targets and invalidation levels, published daily across all 27 instruments.
View Premium Plans