XAGUSD: Two Elliott Wave Paths After the Bounce
Chart: https://s3.tradingview.com/snapshots/p/PWNOAGRu.png
On September 11th, we flagged the downside target on XAGUSD and said to reduce or close positions, with a possible reversal ahead. Silver has since bounced from that zone.
Two paths are still open on the chart. Neither one is confirmed yet, and the bounce itself won't tell you which is correct.
Is silver's wave 5 from the all time high complete?
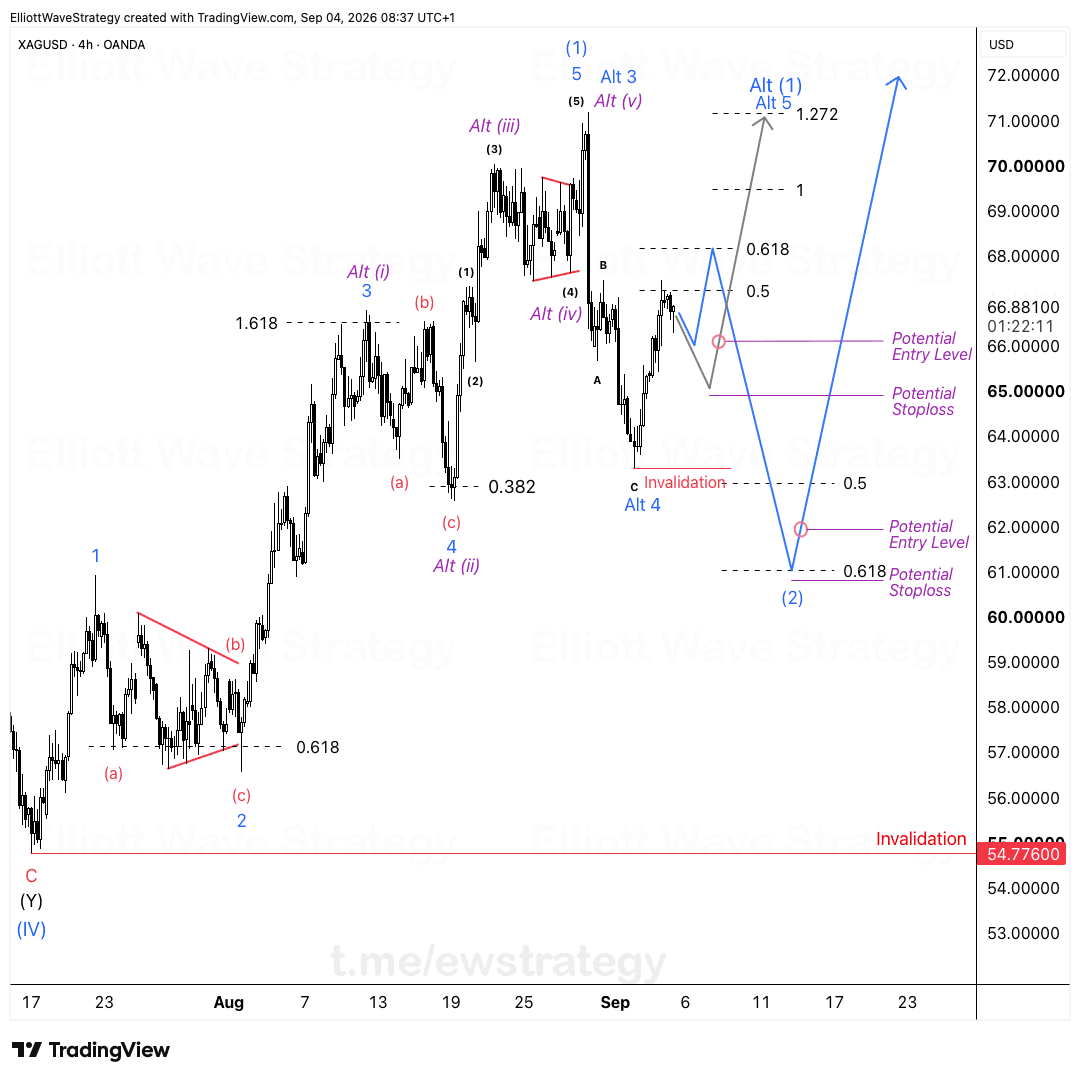
The blue count on the chart labels wave 5 from the ATH as finished. Waves 1 through 5 are marked in blue, with wave 3 extending well past the 1.618 level and wave 4 correcting into the prior fourth wave territory before wave 5 topped out.
If that count is right, this bounce off the low is more than a pause. It could be the start of something bigger, a reversal off the completed five wave decline.
This scenario is invalid below 62.33250. That's the red invalidation line on the chart, sitting right under the recent low.
What if this is just wave (b) of a bigger correction?
The alternative is less friendly. The bounce could simply be the (b) wave inside a larger corrective structure, marked as Alt. ii on the chart.
If that's the case, the rally stalls somewhere between the 0.5 and 0.786 retracement levels shown on the chart, then reverses. More downside follows once wave (b) completes, with Alt. iii projected down toward the 1.272 extension at 58.41782 and the 1.618 extension at 56.34390.
This bullish looking bounce would then just be a corrective wave b, a classic setup where the market gives false hope before continuing the larger decline. The invalidation for this bearish alternative sits above 68.32650, the red line marking the top of the (b)/c structure on the chart.
Why does the current bounce not confirm either scenario?
Both scenarios allow for more upside first. That's the trap.
A bullish reversal count and a corrective wave b count can look identical in their early stages. Price rallies in either case. The difference only shows up later, at the levels where one count breaks and the other survives.
That's why the 62.33250 and 68.32650 levels matter more than the shape of the bounce itself. Until one of those levels gets taken out, silver is trading inside a structure that supports two opposite outcomes.
What should traders watch next on XAGUSD?
The practical takeaway is patience with structure, not prediction. Watch how price behaves near the 0.5, 0.618, and 0.786 retracement levels marked on the chart between 65 and 67.
A sharp rejection near those levels with a five wave decline afterward would favor the corrective Alt. ii path. A continuation higher past 68.32650 would remove the bearish alternative from the table entirely and support the bullish wave 5 reversal reading.
Neither path is guessed at randomly here. Both are mapped against defined invalidation levels, which is the only way to trade an Elliott Wave count that currently has two live interpretations.
Key Takeaways
- •XAGUSD has bounced from the downside target flagged on September 11th, but the bounce alone doesn't confirm a reversal.
- •The bullish XAGUSD count treats wave 5 from the all time high as complete, invalid below 62.33250.
- •The bearish alternative counts the bounce as wave (b) inside a larger correction, targeting the 1.272 and 1.618 extensions near 58.41782 and 56.34390.
- •This bearish XAGUSD scenario is invalidated above 68.32650, which would favor the bullish reversal reading instead.
- •Both silver scenarios allow for more upside first, meaning the shape of the bounce won't reveal the correct path until an invalidation level is hit.
Frequently Asked Questions
What invalidates the bullish XAGUSD reversal count?
The bullish wave 5 completion count is invalidated if price closes below 62.33250. A break below that level would rule out the reversal scenario and support the corrective wave b alternative instead.
What invalidates the bearish XAGUSD wave b count?
The corrective alt ii count, where the bounce is just a wave b inside a larger decline, is invalidated above 68.32650. A close above that level removes the bearish continuation scenario.
Why does silver's bounce not confirm which Elliott Wave count is correct?
Both the bullish reversal count and the bearish wave b count allow for further upside before resolving. The two paths only separate once price reaches the defined invalidation levels near 62.33250 or 68.32650.
Disclaimer: This analysis is for educational purposes only and does not constitute financial advice. Elliott Wave analysis involves subjective interpretation. Always do your own research and manage your risk accordingly.
Get Full Coverage for All 27 Instruments
Premium members receive daily wave counts with entry zones, targets and invalidation levels, published daily across all 27 instruments.
View Premium Plans