XAUUSD Elliott Wave: Complex X Wave Done, Downside Next
The waves are speaking. The question is whether you are listening.
The waves are speaking. The question is whether you are listening.
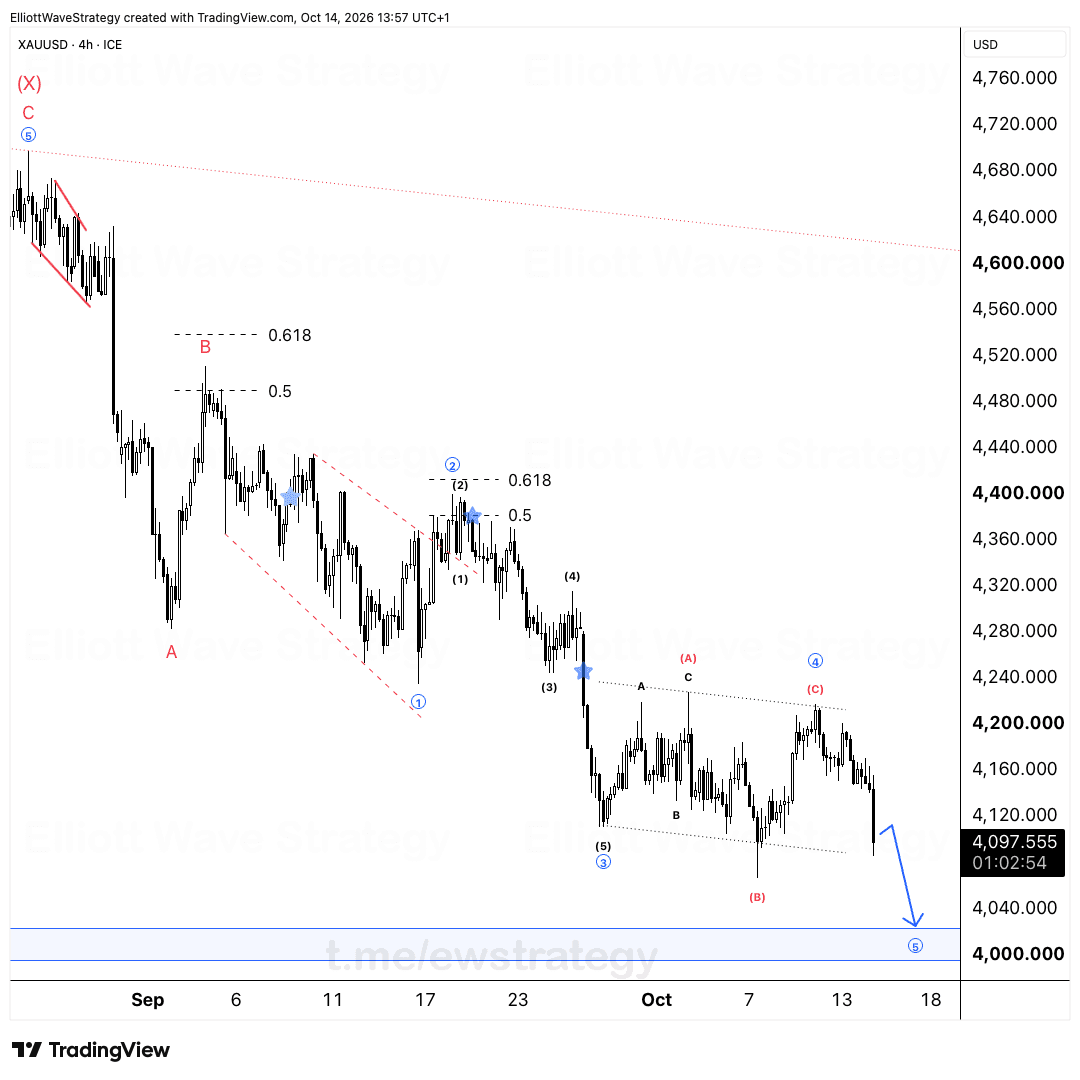
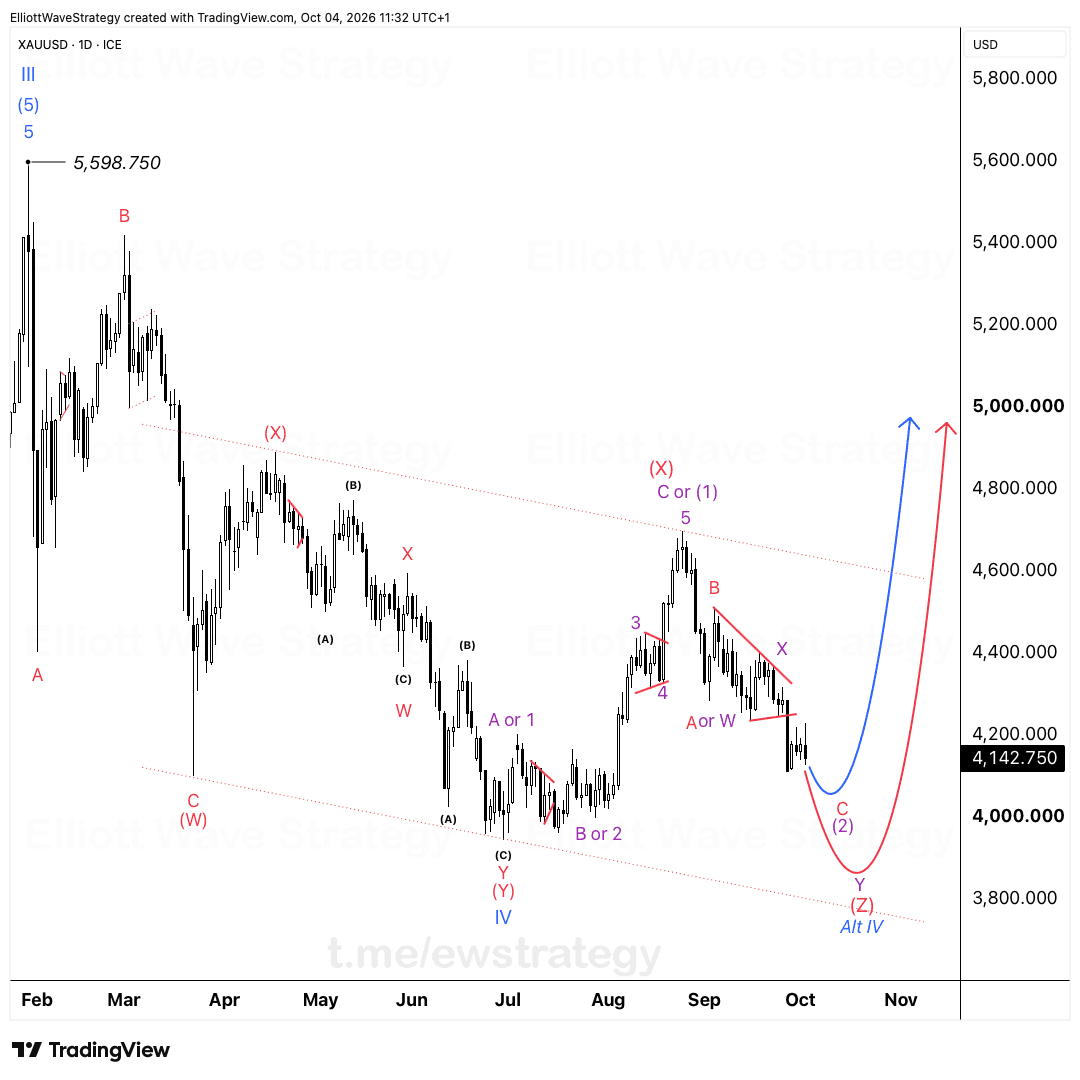
Gold has completed its complex correction on wave X and is now showing early signs of the next decline. The wave count is clear. Price built a drawn out combination since the March low, cycling through waves W, X, Y and another X before capping out in a small five wave move labeled A, B, C into the ⓩ high near 4,890. That is a lot of sideways chop for one reason: it is corrective, not impulsive. Corrections take time and test patience. That is exactly what happened here.
Why does the invalidation sit at 4,890.967?
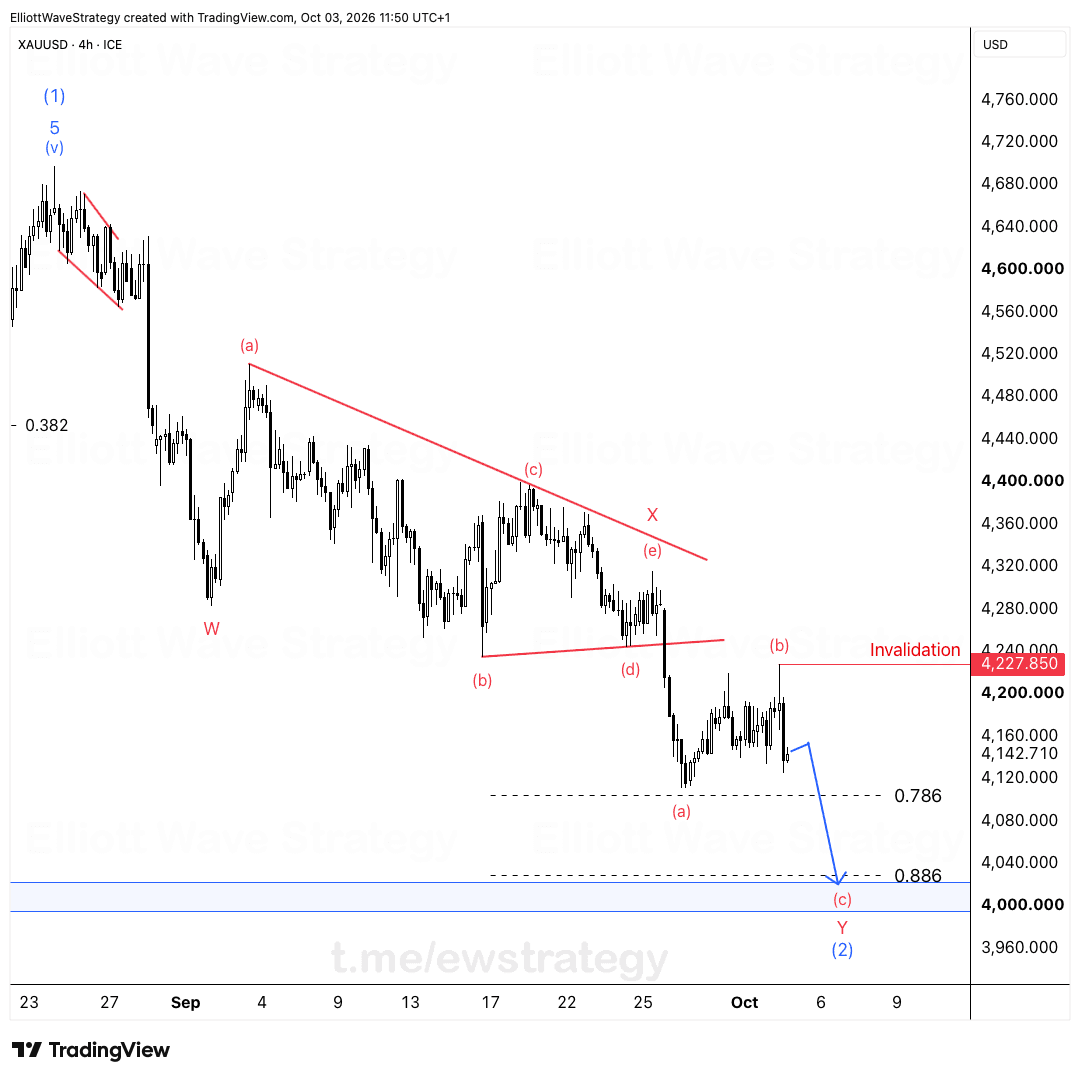
The invalidation is set at 4,890.967, right above the recent ⓩ high. Above that level, the whole bearish count falls apart and we would need to reconsider the structure completely. Right now though, price is respecting that ceiling. The reaction lower into waves 1 and 2 of the new decline fits the picture of a market that already said what it needed to say to the upside.
This level is not decoration. It is the line between a valid corrective top and a count that needs rewriting. As long as XAUUSD stays under 4,890.967, the structure suggests continuation to the downside, targeting the zone marked by the drawn projection well below current price.
What does the wave count actually show on the 4h chart?
Going back through the sequence: wave (5) of the prior impulse bottomed near 4,040, then a Y wave rally into an X wave triangle-like pause, followed by another Y leg up into the ⓐ-ⓑ-ⓒ structure that completed the ⓩ wave. That final ⓒ leg topped just under 4,891, which is now the invalidation.
From there, price has carved a small five wave decline into wave 1, followed by a corrective bounce into wave 2. The wave 2 pullback stalled right around the 0.618 retracement at 4,831.332, a textbook spot for a second wave to end before the next impulsive leg lower takes over. That confluence between the Fibonacci level and the wave count is exactly why the setup here is structural, not guesswork.
Why does this matter for how you trade the move?
This is exactly why we don't chase the noise. We wait for the structure to confirm. The amateur traders who jumped into random trades during the correction are now holding losing positions bought somewhere in the middle of that W-X-Y-X-Z chop. The professionals who followed the wave count were on the sidelines waiting for exactly this kind of setup: a clear invalidation level, a completed corrective structure, and a Fibonacci retracement lining up with wave 2.
Your trading account doesn't care about your feelings. It only cares about your discipline. The count is clear, the invalidation is defined, and the reaction from the 0.618 retracement is doing exactly what it should if this decline is going to extend.
What would change this bearish view?
A daily or 4h close above 4,890.967 breaks the count. That would mean the correction is not finished and a fresh look at the wave structure is needed. Until that happens, the bias stays with the downside continuation from wave 2.
Key Takeaways
- •XAUUSD has completed a complex W-X-Y-X-Z correction that topped just under 4,891.
- •The invalidation level for the bearish XAUUSD count sits at 4,890.967.
- •Wave 2 of the new decline stalled near the 0.618 Fibonacci retracement at 4,831.332, a classic spot for corrections to end.
- •As long as XAUUSD holds below 4,890.967, the Elliott Wave structure favors continuation to the downside.
- •A close above 4,890.967 in XAUUSD would invalidate the current bearish wave count and require a rebuild of the structure.
Frequently Asked Questions
What invalidates the bearish XAUUSD Elliott Wave count?
A move above 4,890.967 invalidates the current bearish count on XAUUSD. That level marks the top of the completed ⓩ wave, and trading above it means the corrective structure is not finished.
Why did wave 2 stop near 4,831.332 on the XAUUSD chart?
Wave 2 retraced into the 0.618 Fibonacci level at 4,831.332, a common area for second waves to end before the next impulsive leg develops. This confluence supports the case that the decline is continuing rather than reversing.
What was the corrective structure before the current XAUUSD decline?
Price built a complex combination of waves labeled W, X, Y, X and Z between March and April, including internal zigzags and a triangle-like X wave, before topping out and turning lower.
Disclaimer: This analysis is for educational purposes only and does not constitute financial advice. Elliott Wave analysis involves subjective interpretation. Always do your own research and manage your risk accordingly.
Get Full Coverage for All 27 Instruments
Premium members receive daily wave counts with entry zones, targets and invalidation levels, published daily across all 27 instruments.
View Premium Plans