XAUUSD Elliott Wave: Wave C Holds 0.618 Fib, Rally Loading
The structure is clear. The plan is set. Now we execute.
Gold has completed its complex correction. That's the read right now, and the structure backs it up.
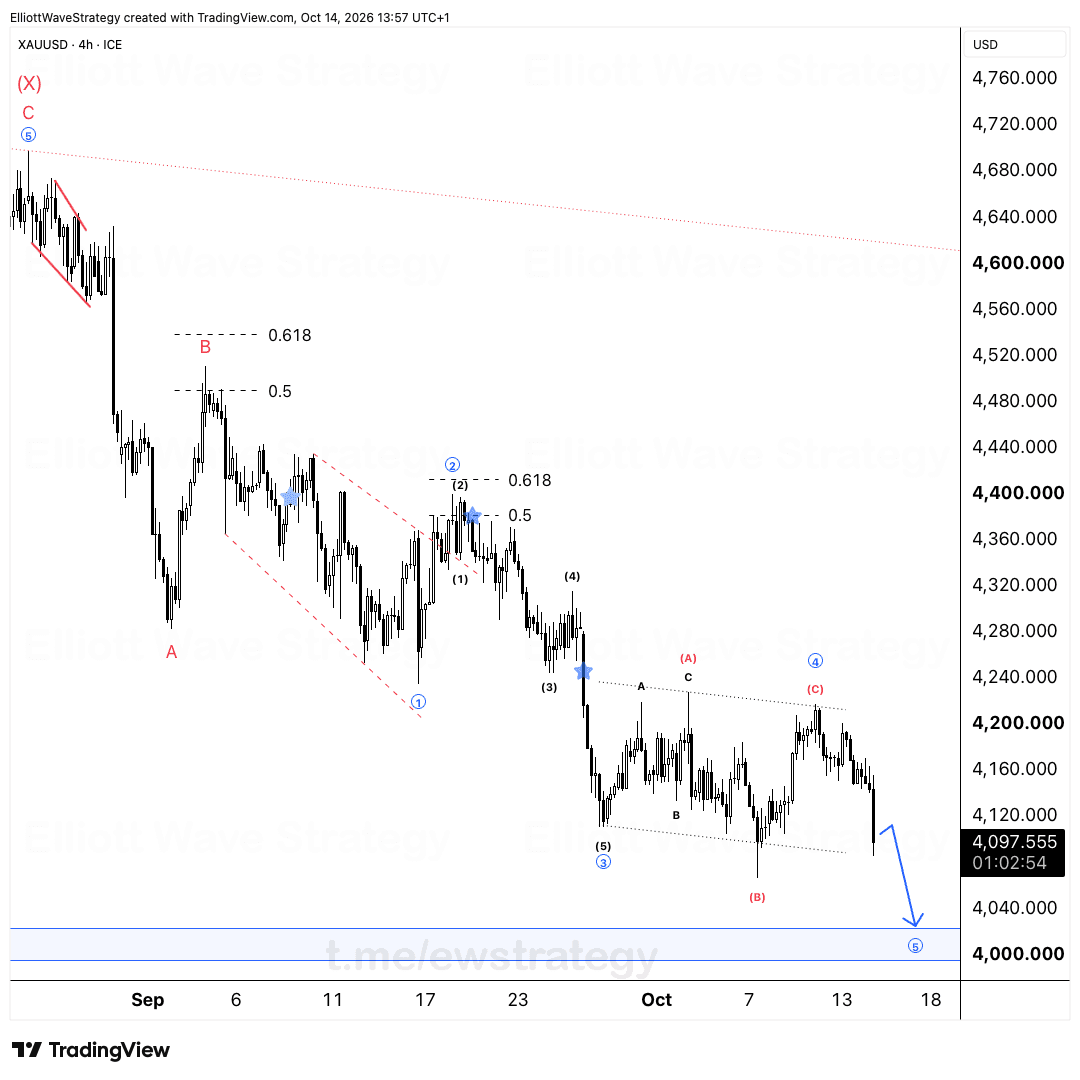
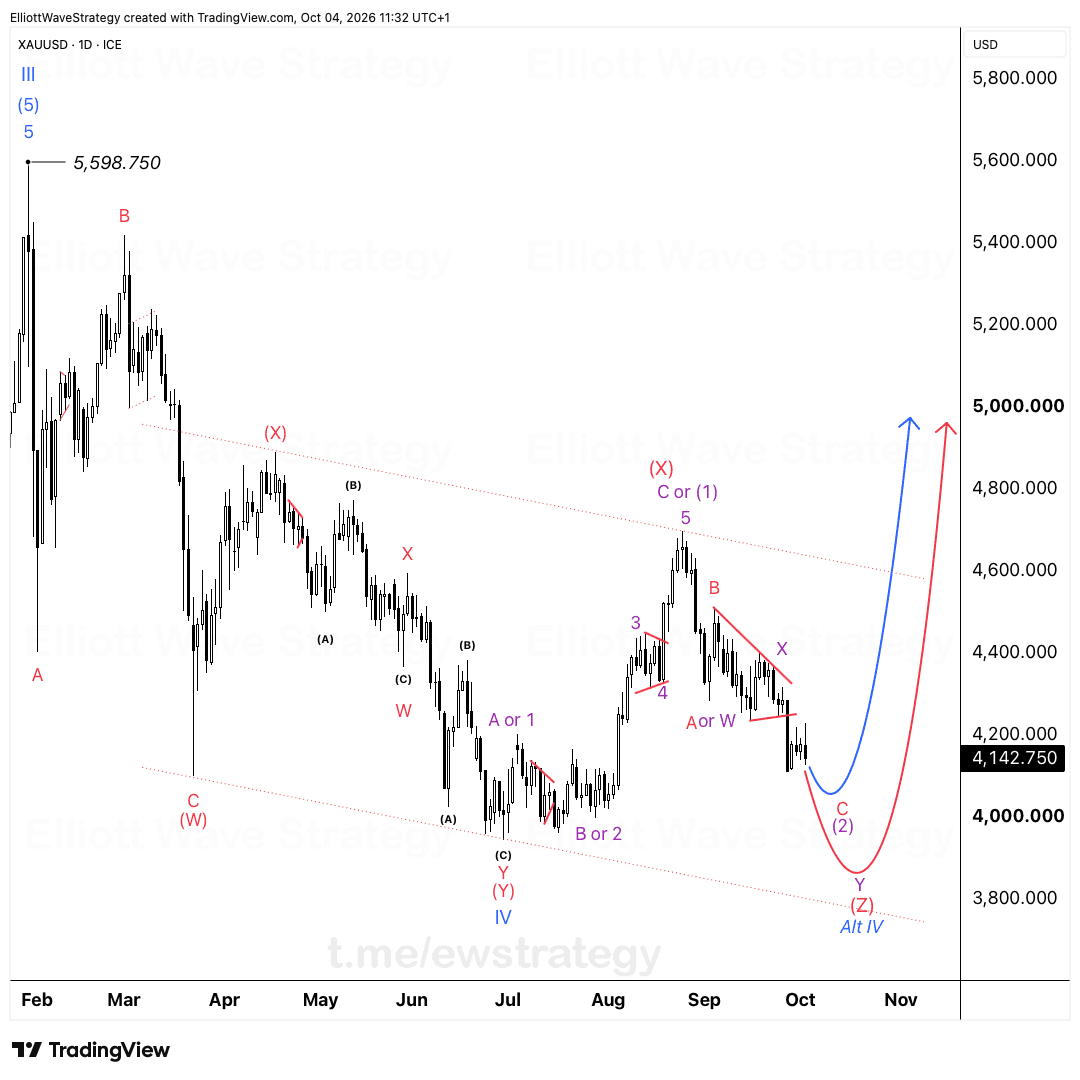
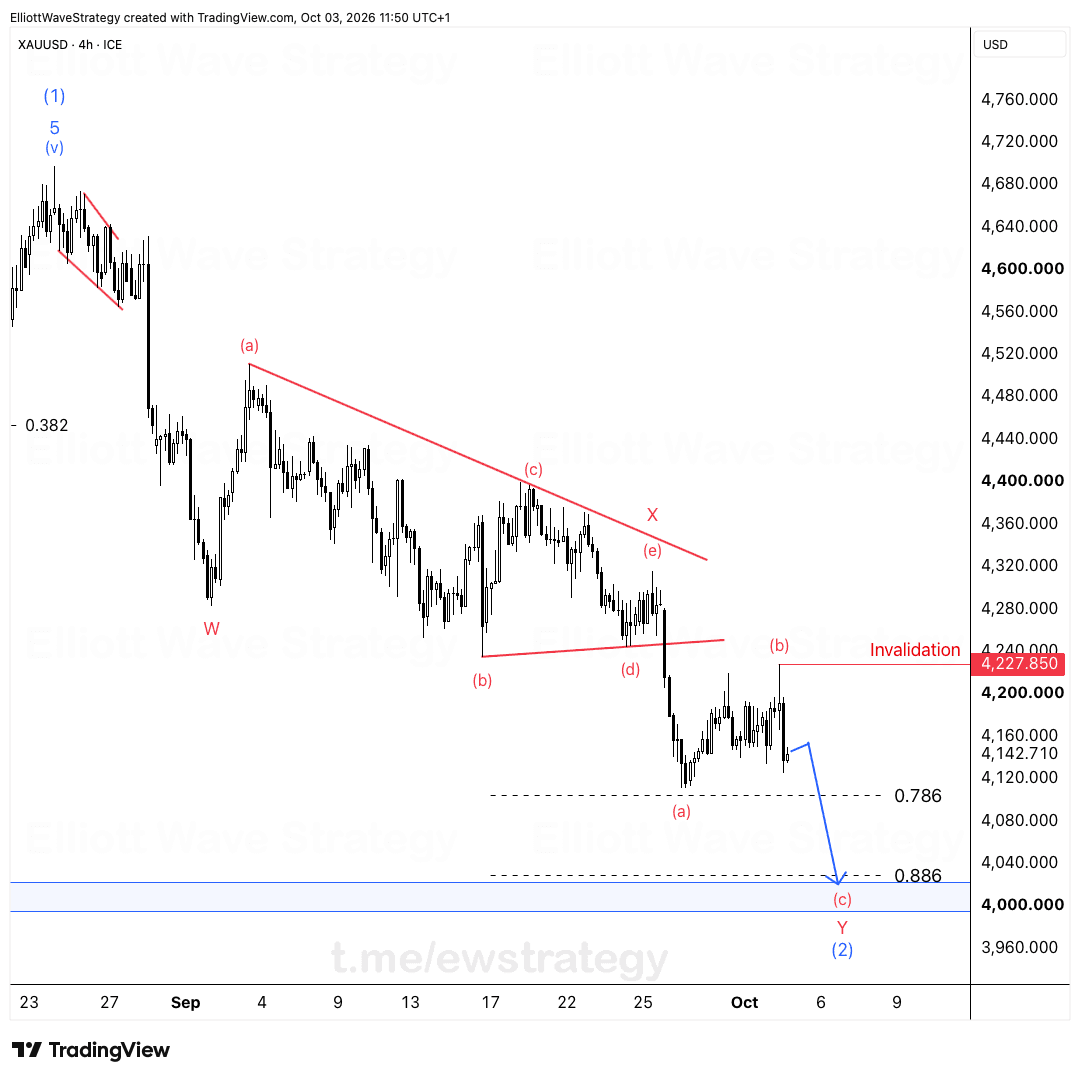
The 4h chart shows a clean ABC zigzag down from the recent highs. Wave A dropped, Wave B corrected higher in a three-wave (a)-(b)-(c) structure, and Wave C pushed lower to find support precisely at the 0.618 Fibonacci retracement of the prior advance. That's not a coincidence. That's Elliott Wave working exactly as it should.
The correction respected Fibonacci support. The structure is complete. The next impulse wave is loading, with the chart's drawn trajectory pointing toward the 4,780 to 4,800 region.
Why does the 0.618 retracement matter here?
Wave C bottoming at the 0.618 level isn't random. In a healthy ABC correction, price often reacts hard at this Fibonacci zone because it represents a common retracement depth for corrective waves. When Wave C respects this level instead of blowing through it, that's the market telling you the correction is done and buyers are stepping back in.
A second Fibonacci reference sits nearby: the 0.786 retracement, marked just below the (c) wave completion. Price found its floor between these two Fib levels, which reinforces the case that the corrective sequence has run its course rather than extending further.
What does the ABC zigzag structure tell traders?
A zigzag correction breaks down into three legs: A, B, and C. Wave A initiates the move, Wave B retraces part of it, and Wave C completes the pattern, usually extending beyond the end of Wave A. That's exactly what's printed on this XAUUSD chart, with the (A), (B), (C) labels marking each leg clearly.
Once a zigzag completes, the market typically transitions into an impulsive move in the opposite direction. That's the setup here. The correction is the pause, and the next leg is the trend resuming.
How should traders treat the invalidation level?
This is the part most traders get wrong. They plan the entry and the target, then abandon the plan the moment price wiggles against them.
The invalidation on this chart sits at 4,365.850. If price breaks below that level, the ABC count is wrong and the whole bullish thesis falls apart. That's not a maybe. That's the line in the sand.
Professionals don't chase price after it moves. They don't FOMO into a trade because it's already running. They set the entry zone, the target, and the invalidation, then they let the market decide. If it breaks the invalidation, that's a small loss and you move on. If it respects the plan, you ride the wave to the target.
Closing thought
The structure is clear. The plan is set. Now it's about execution and discipline, not second-guessing the count every time a candle closes the wrong color. One planned trade at a time is how consistency gets built, not by chasing every green candle after the fact.
Key Takeaways
- •XAUUSD completed an ABC zigzag correction with Wave C bottoming at the 0.618 Fibonacci retracement.
- •The invalidation level for the current XAUUSD Elliott Wave count sits at 4,365.850.
- •A break below invalidation would void the bullish impulse count entirely, not just delay it.
- •The next impulse wave on XAUUSD is projected toward the 4,780 to 4,800 zone based on the drawn trajectory.
- •Discipline around entry, target, and invalidation separates planned trading from chasing price.
Frequently Asked Questions
What invalidates the bullish XAUUSD Elliott Wave count?
A break below 4,365.850 invalidates the current ABC correction count and the projected impulse wave higher.
Why did Wave C stop at the 0.618 Fibonacci level?
The 0.618 retracement is a common completion zone for corrective C waves in a zigzag, and price respecting it signals the correction is likely finished.
What comes after an ABC zigzag correction completes?
Once a zigzag correction finishes, the market typically resumes its prior trend with an impulsive five-wave move in the original direction.
Disclaimer: This analysis is for educational purposes only and does not constitute financial advice. Elliott Wave analysis involves subjective interpretation. Always do your own research and manage your risk accordingly.
Get Full Coverage for All 27 Instruments
Premium members receive daily wave counts with entry zones, targets and invalidation levels, published daily across all 27 instruments.
View Premium Plans