XAUUSD Elliott Wave: Gold Nears Final C Wave, RSI Diverges
We said the structure points lower. Gold listened.
We said the structure points lower. Gold listened.
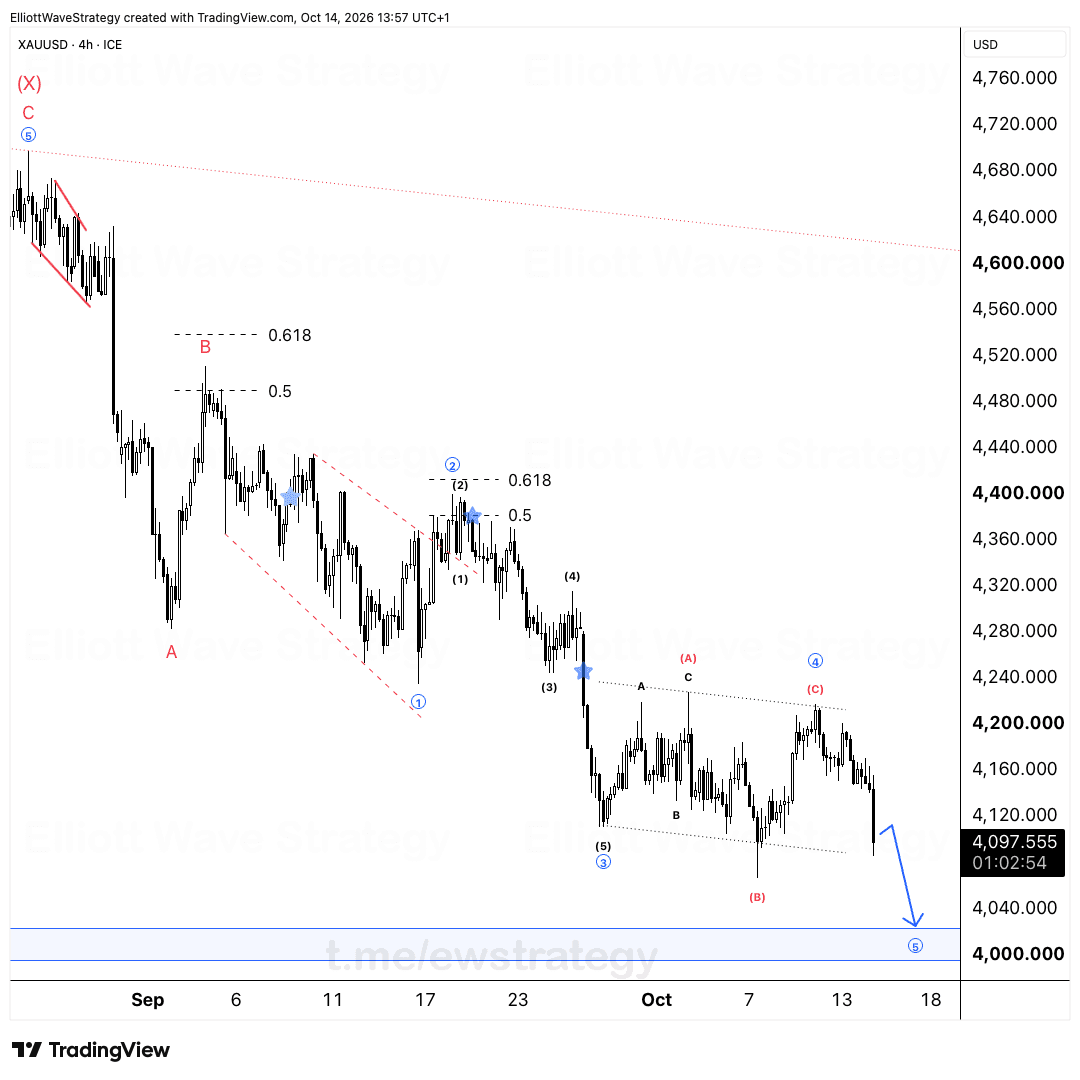
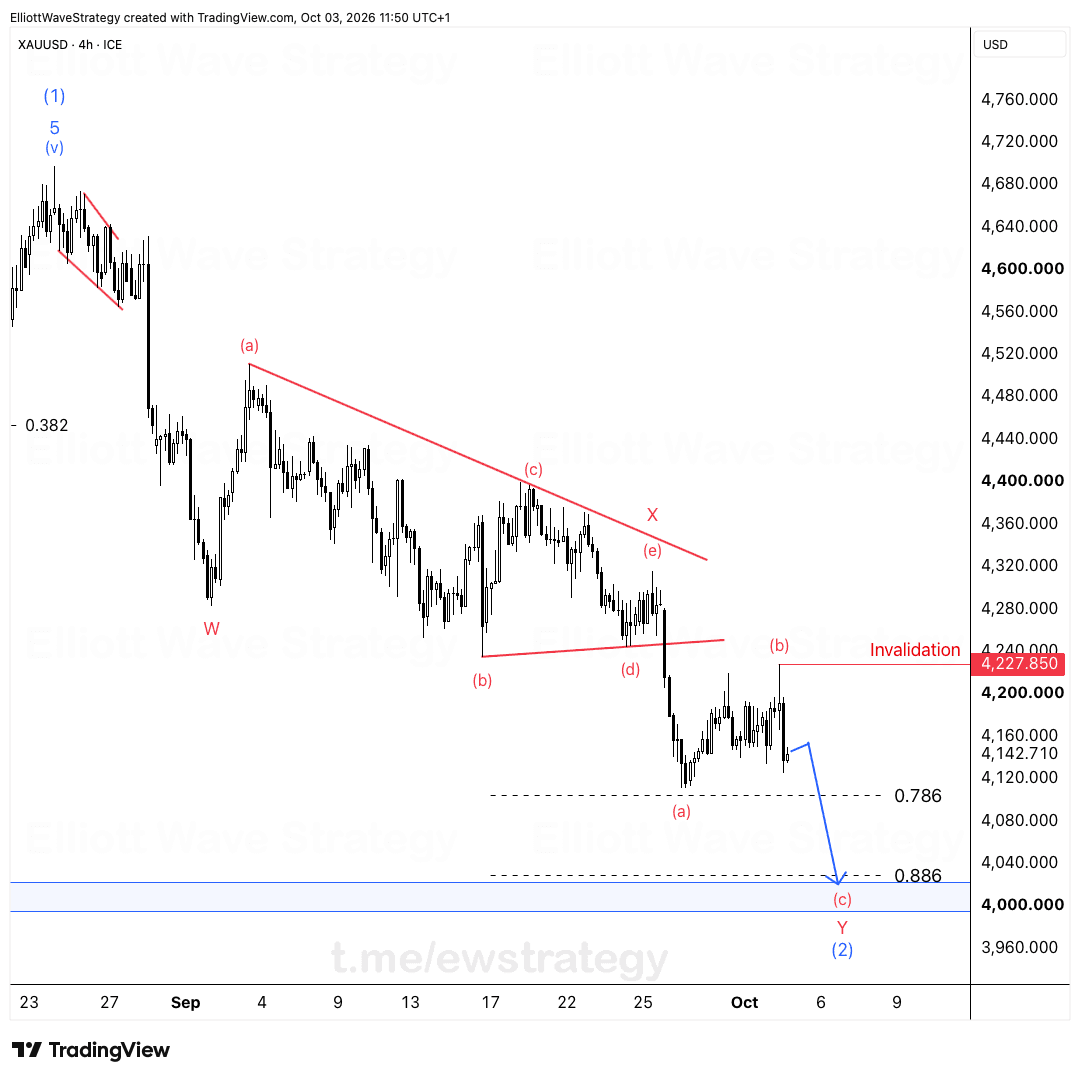
The decline from the highs has been tracing out a clean descending sequence. Wave (iii) down, wave (iv) up, and now wave (v) of C is completing the larger (Y) leg. Price is grinding into the lower boundary of the descending channel, exactly where a final C wave is supposed to end.
What does the wave count say about XAUUSD right now?
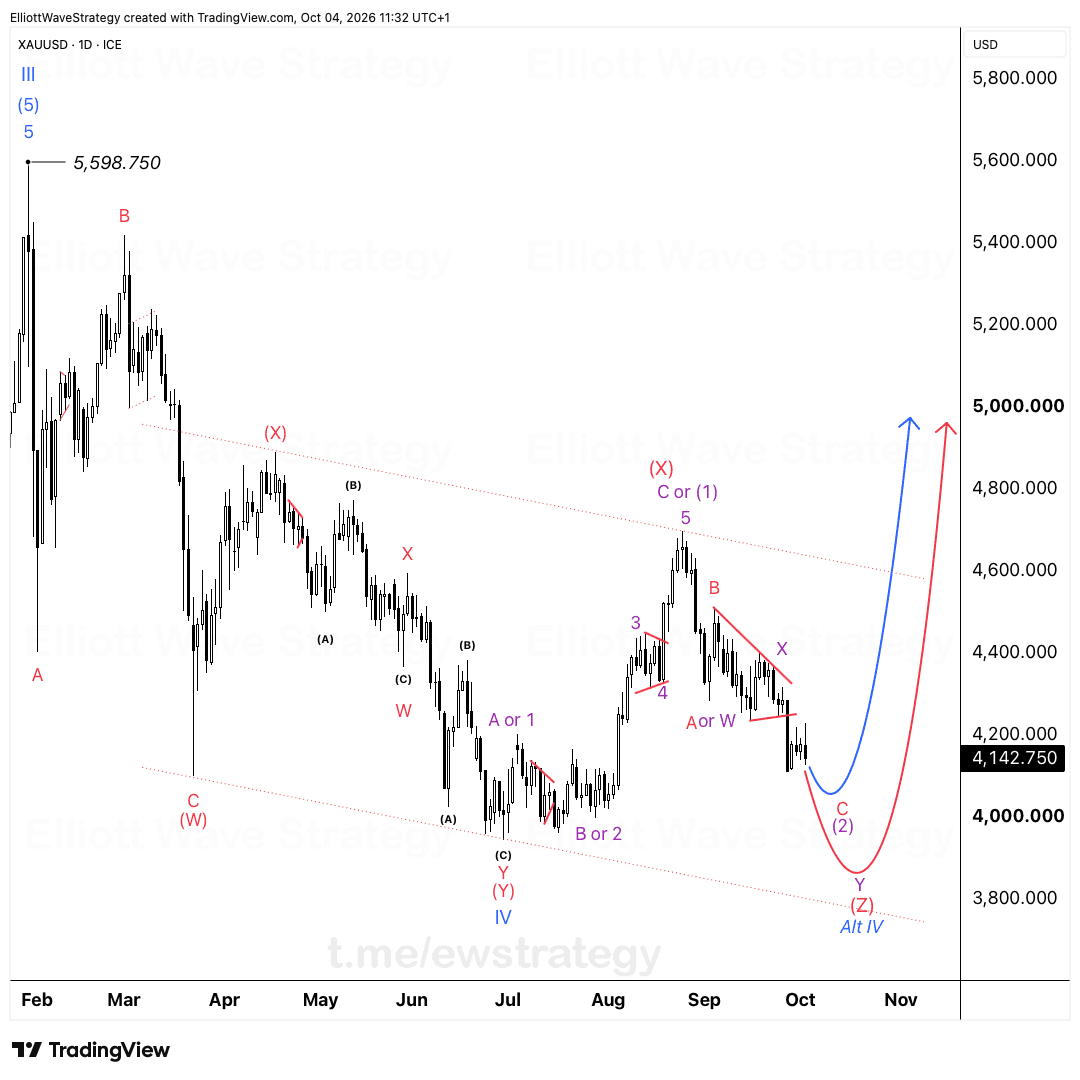
Zoom out and the picture is straightforward. This whole move down is a (Y) leg inside a larger correction, built from a five wave impulse: (i), (ii), (iii), (iv), and the current (v). Inside that final (v), we're counting a smaller A, B, C sequence, with C now pushing into the lower trendline of the channel that has contained price since the highs.
That channel isn't decorative. It's been respected on every touch, from wave (i) at the top through wave (iii) and now into this final leg. A C wave ending right at structural support is exactly the kind of setup that ends corrective sequences, not extends them.
Why does the RSI divergence on gold matter here?
Here's the part that separates this from just another leg down. RSI is printing higher lows while price prints lower lows. The AO histogram shows the identical pattern.
That's not noise. Momentum indicators diverging from price while price approaches a major trendline is one of the more reliable tells that selling pressure is drying up, even as the candles keep pushing lower. Sellers are still in control on paper, but they're doing less work to get the same result.
One more leg lower into that channel support, and the larger turn could begin. Not before that.
What would confirm or invalidate the bullish turn on XAUUSD?
The setup only makes sense if price respects the channel's lower boundary during this final push. A clean tag of that trendline alongside continued RSI and AO divergence is what a textbook end to wave (v) of C looks like.
If price slices through that boundary with force and momentum breaks down alongside it rather than diverging, the (Y) leg isn't finished and the whole count needs revisiting. Until then, the divergence stands as a warning sign for anyone still assuming this decline runs forever.
The real lesson in this chart
This is what trading is really about. Being positioned before the crowd notices, not chasing candles after the reversal is obvious.
The turn is coming. The only question is whether you watch it happen or you're already positioned for it.
Key Takeaways
- •XAUUSD is completing wave (v) of C, the final leg of a larger (Y) correction on the 4H chart.
- •Price on XAUUSD is approaching the lower boundary of a descending channel that has held since the highs.
- •RSI and AO are both showing bullish divergence, higher lows in momentum against lower lows in XAUUSD price.
- •One more leg lower into channel support is what the current count calls for before a larger turn can begin.
- •A clean break below the channel with momentum confirming, rather than diverging, would invalidate this bullish setup for gold.
Frequently Asked Questions
What invalidates the bullish count on XAUUSD?
If price breaks decisively below the channel's lower boundary and momentum indicators like RSI and AO break down instead of diverging, the wave (v) of C count is invalidated and the decline likely extends further.
Why does RSI divergence matter in an Elliott Wave count?
Divergence between price and momentum during a suspected final wave, like wave (v) of C here, signals fading selling pressure and often precedes a reversal at structural support or resistance.
What wave is gold currently in?
Gold is tracing wave (v) of a larger C wave, which completes the (Y) leg of a corrective sequence, with price currently pushing into the lower boundary of its descending channel.
Disclaimer: This analysis is for educational purposes only and does not constitute financial advice. Elliott Wave analysis involves subjective interpretation. Always do your own research and manage your risk accordingly.
Get Full Coverage for All 27 Instruments
Premium members receive daily wave counts with entry zones, targets and invalidation levels, published daily across all 27 instruments.
View Premium Plans