XAUUSD Elliott Wave: 4,203 Broke, Plan B Now Active
Yesterday's setup got invalidated. That's the whole point of publishing invalidation levels before the move, not after.
Yesterday's XAUUSD setup got invalidated. That's the whole point of publishing invalidation levels before the move, not after.
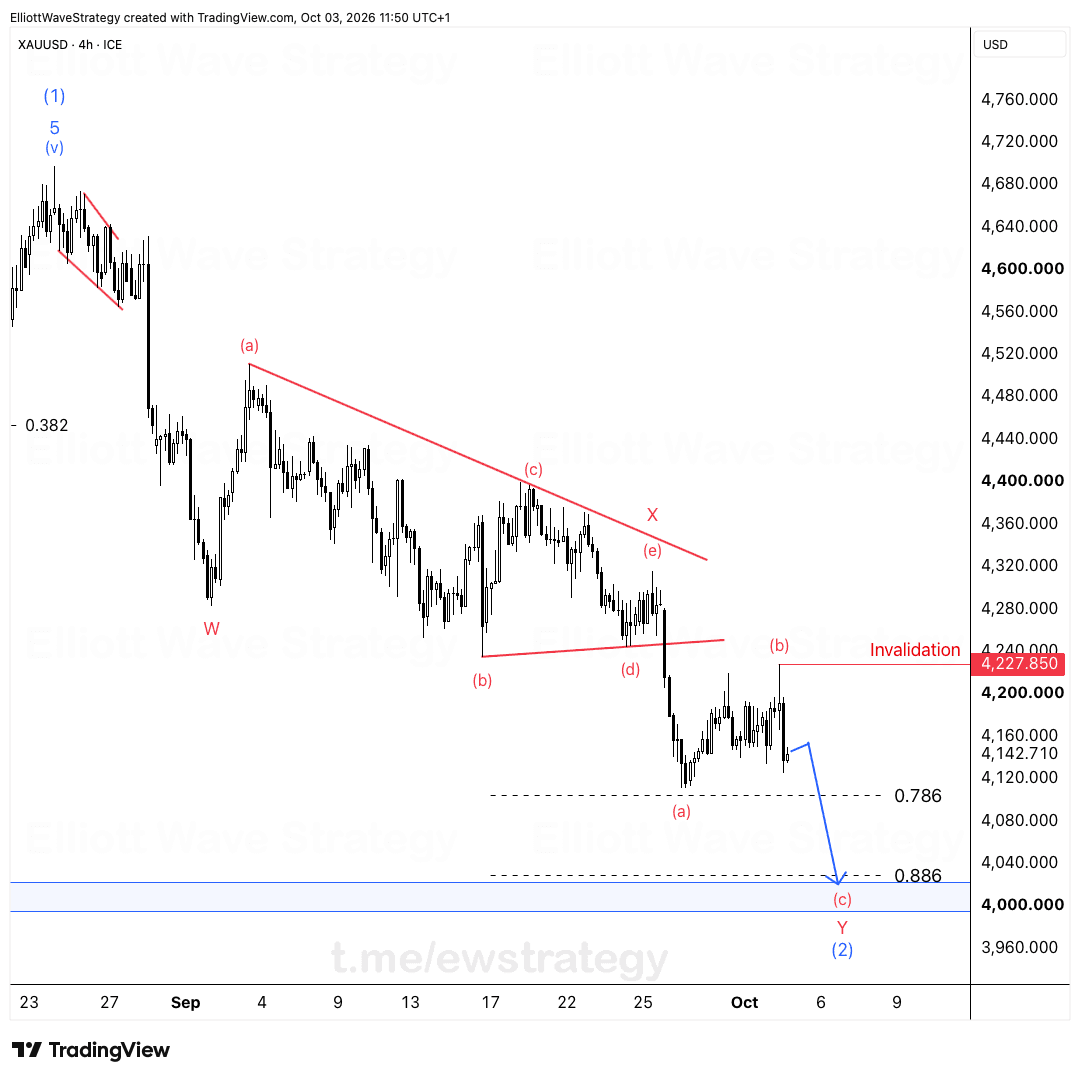
4,203 was the line. Price broke it. The count is closed. No arguing with the chart, no holding on to an idea just because we liked it.
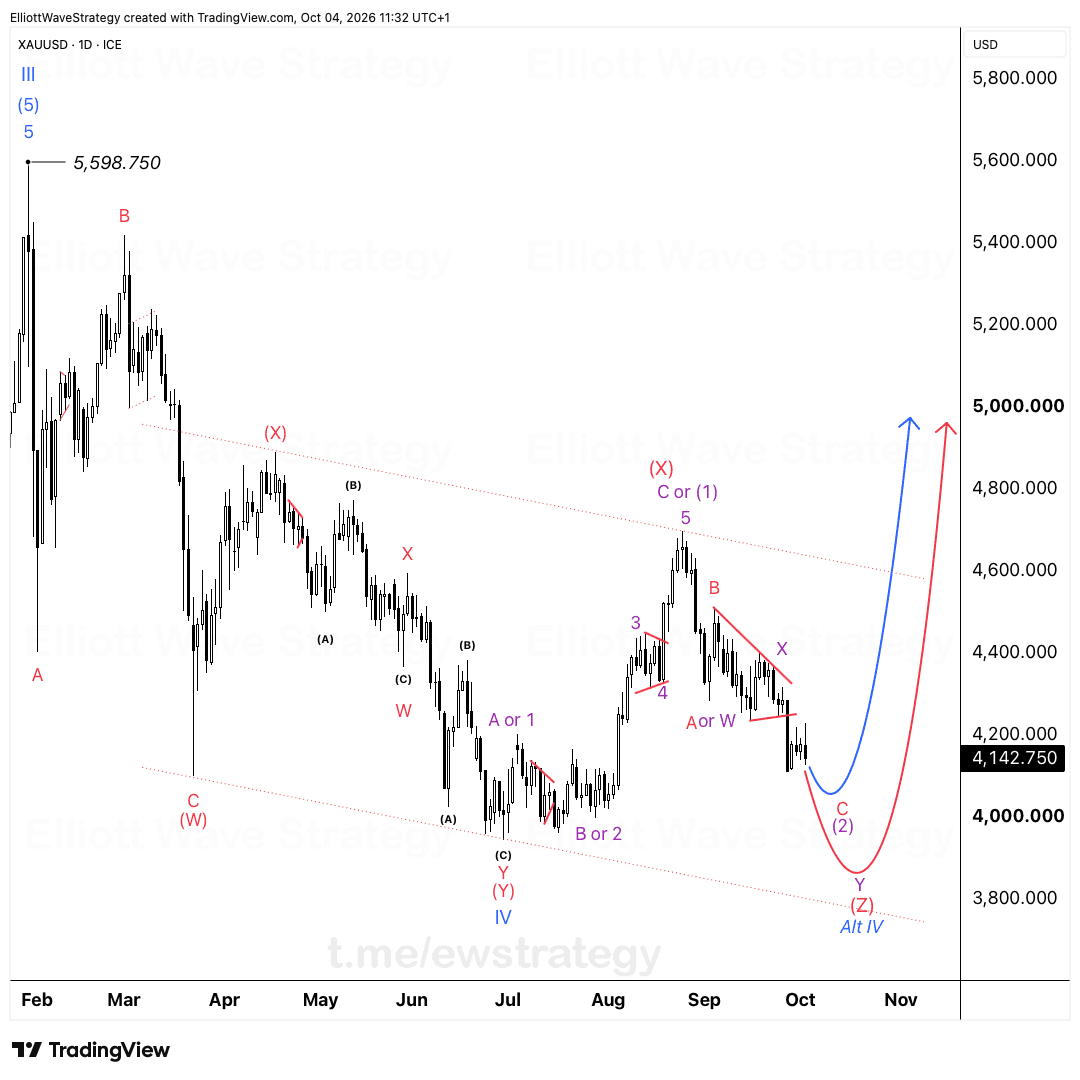
This is XAUUSD on the daily, and the wave count has been building since the wave (W) low back near March. From there we got the (X) wave zigzag lower, then a rally into wave 3 or C of (X), followed by a five wave decline into what was labeled wave 4. That wave 4 was tracking as a WXY correction, with the A, X, and B legs already printed on the chart. The question was always whether 4,203 would hold as the floor for that structure.
It didn't. Price broke through, and that single fact closes one entire branch of the analysis.
What was the bullish scenario for XAUUSD?
The bullish path had wave 4 completing as a WXY structure, with the B wave failing at the 0.382 to 0.5 retracement zone and price turning back up from support at 4,203. Had that held, wave 5 would resume the impulse from wave (5) of III, projecting toward new highs on the blue path shown on the chart. That scenario is now closed. It required 4,203 to act as support, and it didn't.
What does the bearish scenario show now?
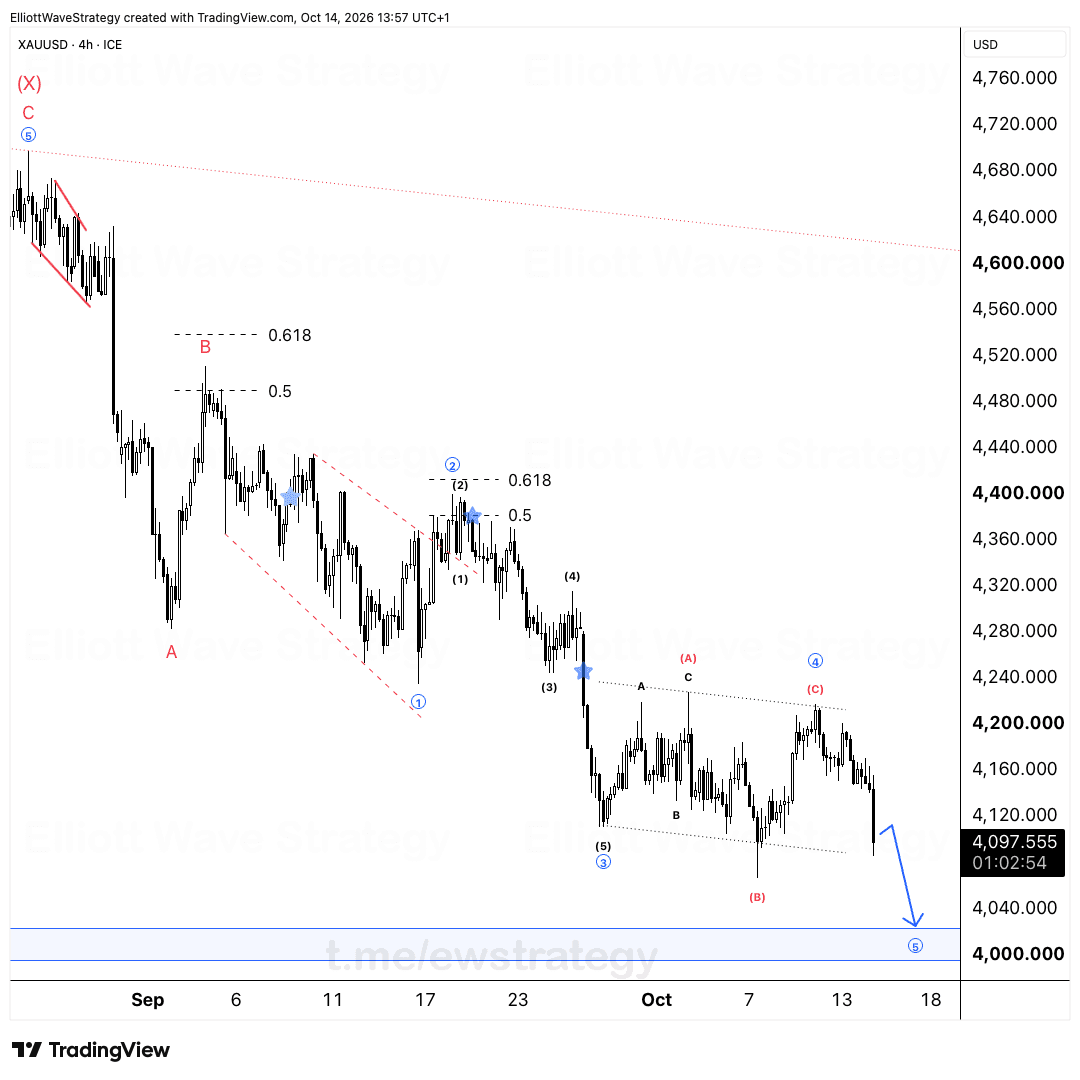
Below 4,203, the count shifts to a deeper wave IV, unfolding as a Y-(Z) structure. The A wave down, B wave bounce, and now a C wave targeting the lower zone marked on the chart, near the 3,800 region, is the active path. This is the red trajectory, and it implies XAUUSD has more downside work to do before wave IV completes and any resumption toward wave 5 becomes relevant again.
Why does an invalidation level matter more than the direction?
Both scenarios were mapped out in advance. That's what a plan looks like. It tells you when you're right and when you're not. The 4,203 line wasn't a guess, it was the exact point where the bullish WXY count would fail and hand control to the bearish Y-(Z) alternative. Once price traded through it, there was nothing left to debate.
You're not a forecaster. You're a risk manager. Your job isn't to be right every time, it's knowing exactly what you'll do when you're wrong. XAUUSD just gave a clean example of that discipline in action.
Key Takeaways
- •XAUUSD broke below the 4,203 invalidation level, closing the bullish WXY wave 4 count.
- •The bearish scenario for XAUUSD now points to a deeper wave IV unfolding as a Y-(Z) structure.
- •The bearish XAUUSD path targets the lower zone near 3,800 for the C wave of (Z).
- •Both bullish and bearish paths for XAUUSD were mapped in advance around the 4,203 line.
- •Invalidation levels exist to tell traders when a count is wrong, not just when it's right.
Frequently Asked Questions
What invalidated the bullish XAUUSD wave 4 count?
A break below 4,203 invalidated the WXY wave 4 structure that would have supported a resumption of wave 5 toward new highs.
What is the bearish target for XAUUSD after the 4,203 break?
The bearish Y-(Z) structure for wave IV targets the lower zone on the chart, near the 3,800 area, for the C wave completion.
Is XAUUSD still bullish long term?
The larger degree count still allows for a wave 5 advance later, but only after the deeper wave IV correction, now tracking as Y-(Z), plays through to its C wave low.
Disclaimer: This analysis is for educational purposes only and does not constitute financial advice. Elliott Wave analysis involves subjective interpretation. Always do your own research and manage your risk accordingly.
Get Full Coverage for All 27 Instruments
Premium members receive daily wave counts with entry zones, targets and invalidation levels, published daily across all 27 instruments.
View Premium Plans