XAUUSD Elliott Wave: Blue vs Red
You don't have to predict the market. Nobody knows where gold goes next. Not us, not anyone. And that's fine.
You don't have to predict the market. Nobody knows where gold goes next. Not us, not anyone. And that's fine.
Most traders fight this. They try to guess the next move and be right often enough to make it work. That's one of the biggest mistakes in trading. Markets just don't work that way.
Right now XAUUSD is sitting at a fork. Two counts, two very different outcomes, and one clean line in the sand that tells you which one is dead.
What does the blue path mean for XAUUSD?
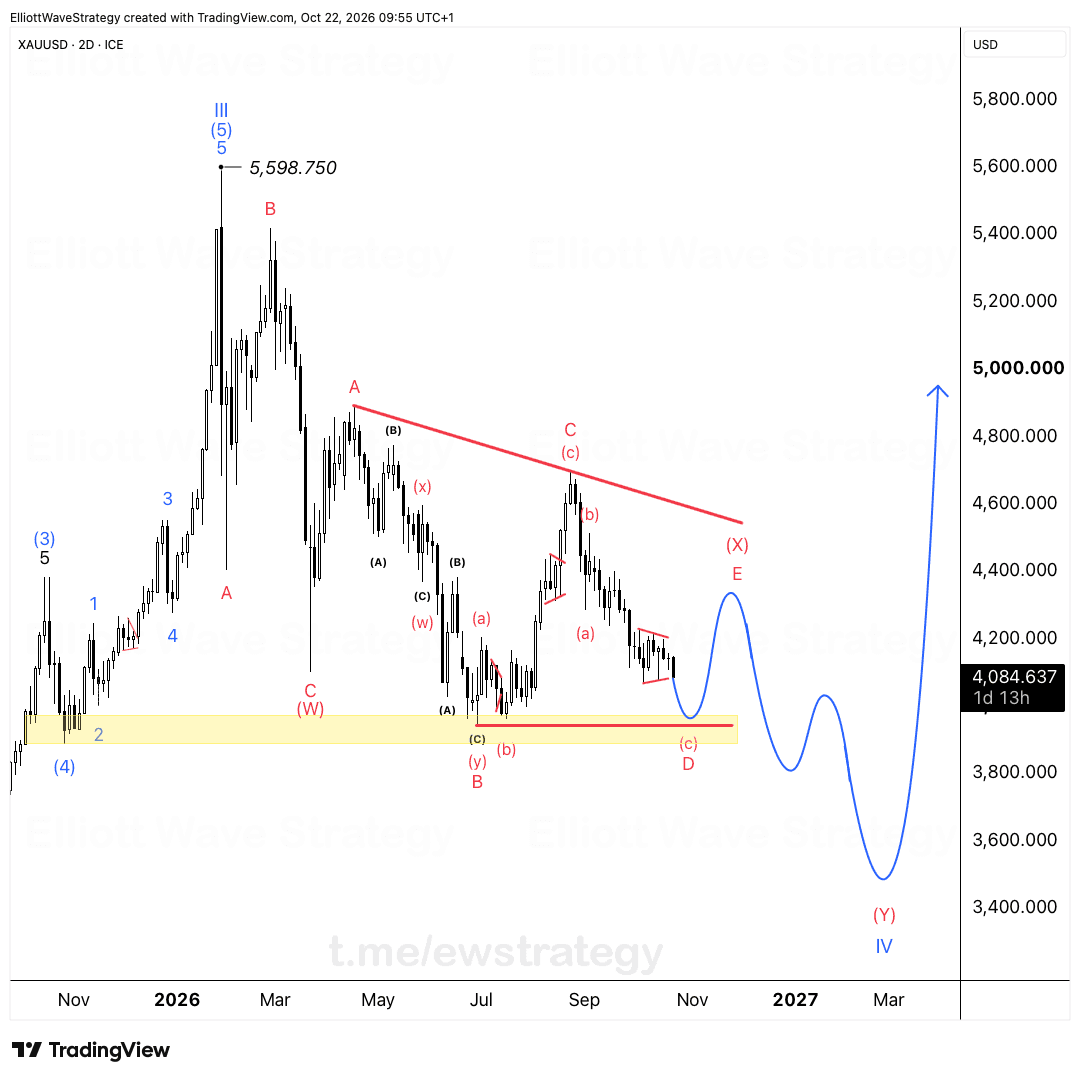
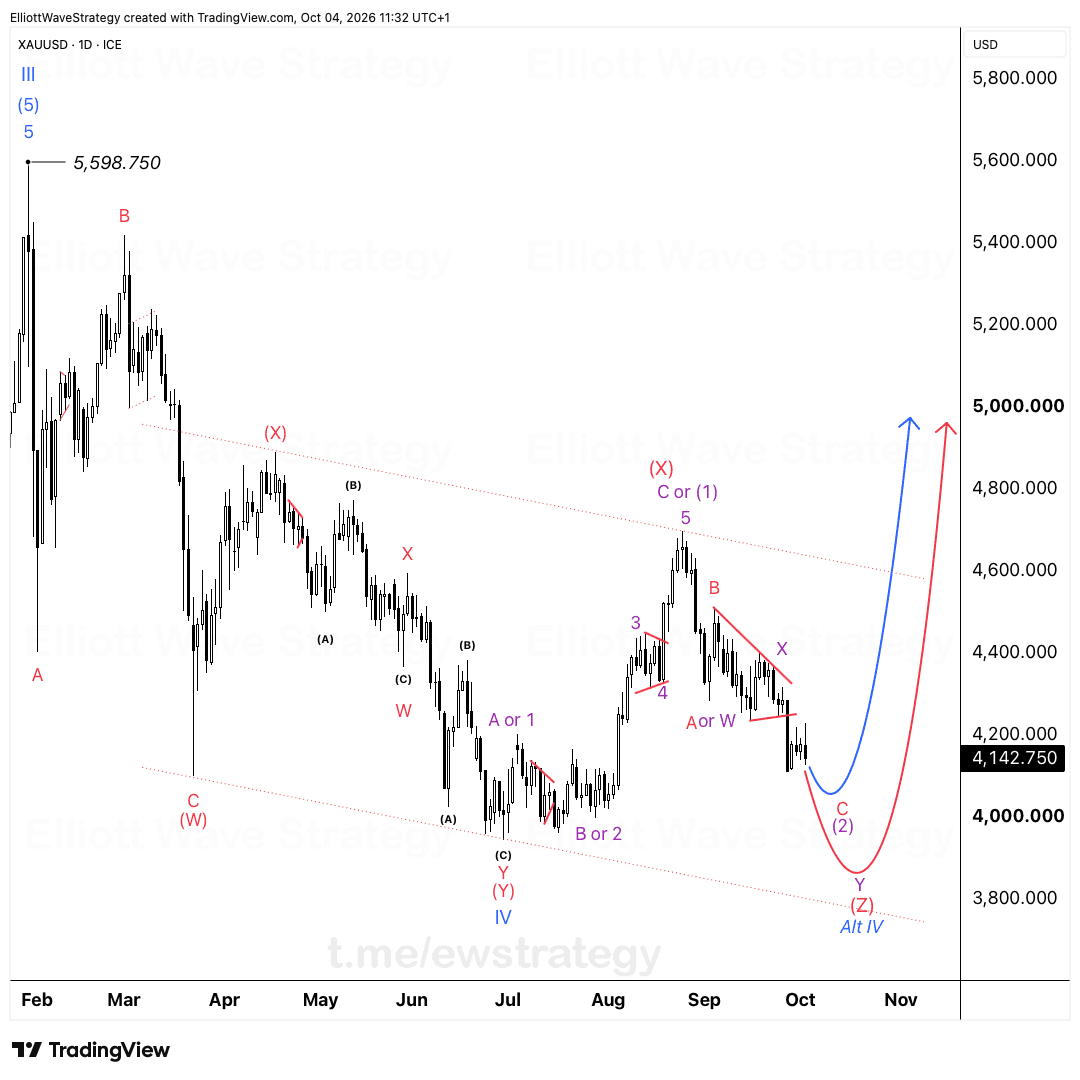
The blue scenario counts the recent decline as wave ii or b, now complete. If that's correct, gold has room to push toward new highs, the kind of move drawn straight off the top of the chart toward the 4,800 region.
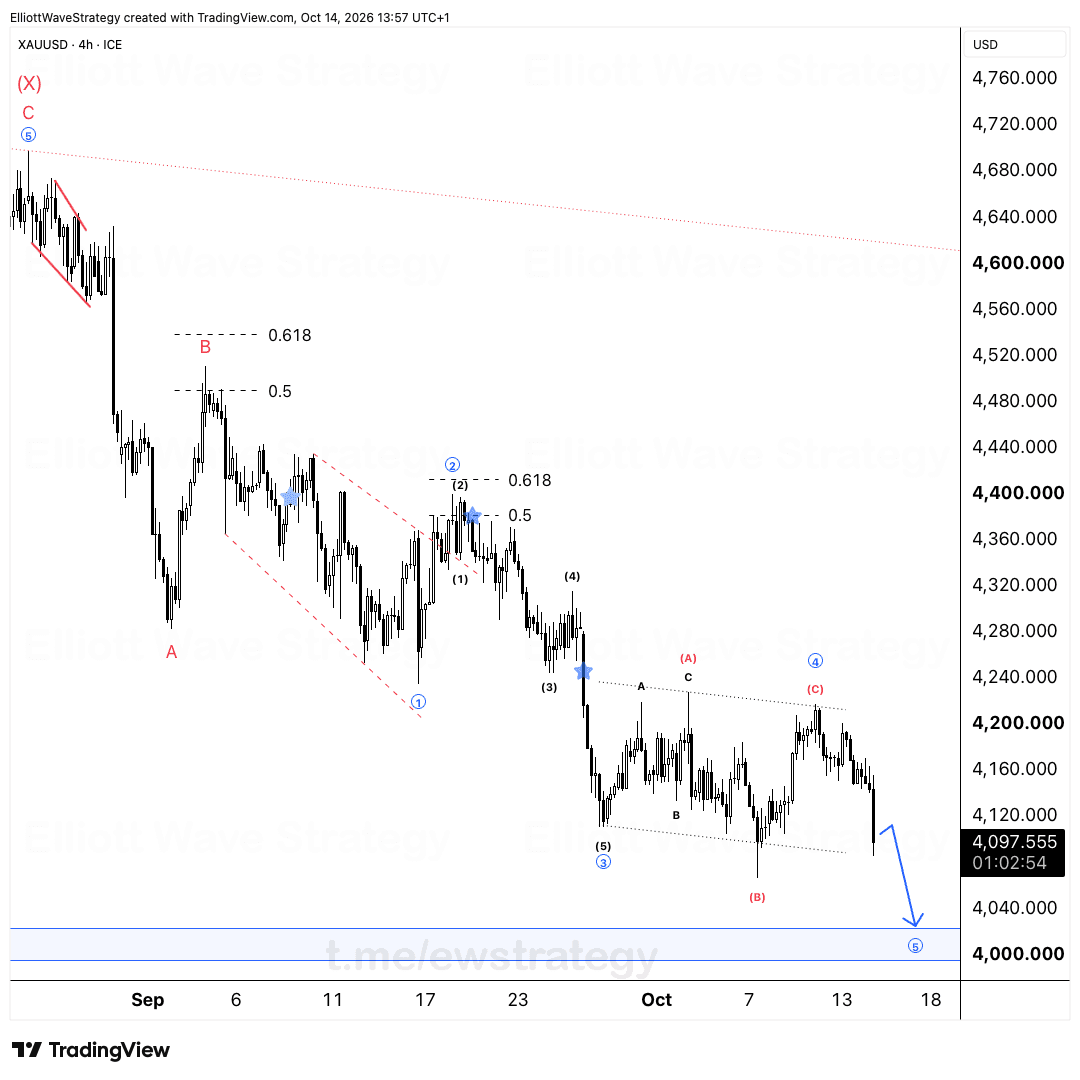
This is the bullish continuation case. Wave (X) or wave 3/circle 5 already printed the prior high near the 4,600 to 4,650 area, and this pullback is just the pause before the next leg up. The 0.5 and 0.618 retracement marks near 4,350 held so far, which is exactly what a wave ii or b should do.
What does the red path mean for XAUUSD?
The red path treats this entire bounce as Alt B or wave X, a corrective bounce inside a bigger topping structure, not the start of something new. Under this count, the current rally is a countertrend move that runs out of gas in the 4,450 to 4,500 zone, right where the 0.5 and 0.618 Fibonacci retracements stack up.
If price stalls there and turns down, the red path calls for a deeper Alt C decline, dragging gold toward the 1.272 and 1.618 extensions near 4,000 and 3,850. That's a completely different market than the blue path, and the two don't overlap for long.
Where does the blue scenario get invalidated?
Here's the part that actually matters for how you manage this. A break below 4,282 invalidates the blue scenario entirely. Below that level, the wave ii or b count is dead, and the red path, Alt B or wave X capping out before a bigger decline, takes over.
That's the whole plan. Not a prediction of which way gold goes, just a clear line that tells you when one story stops being valid. Above 4,282, both counts can technically coexist while price decides. Below it, only one survives.
Why trade the fork instead of guessing the outcome
Most traders want to know now whether gold is going to 4,800 or down to 3,850. That urge to pick a side early is what gets people hurt. The market doesn't owe anyone an early answer.
The better approach is watching the 4,450 to 4,500 ceiling and the 4,282 floor. Price action at those two zones will do the talking. Until then, both paths stay on the table, and that's not indecision, that's just how Elliott Wave analysis works when a chart is genuinely at a fork.
Key Takeaways
- •XAUUSD is at a fork between a bullish wave ii/b count and a bearish Alt B or wave X count.
- •The blue bullish path targets new highs toward 4,800 if wave ii or b has completed.
- •The red bearish path caps XAUUSD near 4,450 to 4,500 before a deeper Alt C decline toward 4,000 and 3,850.
- •A break below 4,282 invalidates the blue scenario for XAUUSD and hands control to the red path.
- •Traders don't need to predict which XAUUSD path plays out, just watch the 4,450-4,500 zone and the 4,282 invalidation.
Frequently Asked Questions
What invalidates the bullish XAUUSD Elliott Wave count?
A break below 4,282 invalidates the blue wave ii or b scenario for XAUUSD. Below that level the red Alt B or wave X count takes over, favoring a deeper decline.
Where is the resistance zone for the current XAUUSD bounce?
The 0.5 to 0.618 Fibonacci retracement zone between roughly 4,450 and 4,500 is the area where the red path expects the bounce to fail before a decline toward 4,000 and lower.
Is XAUUSD bullish or bearish right now under Elliott Wave?
Both remain possible. The blue count is bullish toward new highs near 4,800, the red count is bearish toward 4,000 and 3,850, and the 4,282 level separates which one stays valid.
Disclaimer: This analysis is for educational purposes only and does not constitute financial advice. Elliott Wave analysis involves subjective interpretation. Always do your own research and manage your risk accordingly.
Get Full Coverage for All 27 Instruments
Premium members receive daily wave counts with entry zones, targets and invalidation levels, published daily across all 27 instruments.
View Premium Plans