
DXY Is a Basket, Not a Currency
The dollar index is 57.6% euro, contains six currencies, and has been revised once since 1973. Here is what that means for your DXY wave count, plus the cross-check it gives you for free.
Quick answer: The US Dollar Index is a geometric weighted average of the dollar against six currencies, and the euro alone accounts for 57.6% of it. Add the pound and the Swiss franc and roughly three-quarters of the index moves with western Europe. The basket has been revised once since it launched in 1973, when the euro replaced five legacy European currencies in 1999, so it reflects a trade picture that no longer exists. Practically, this means a DXY wave count is largely an inverted EURUSD wave count, and when the two disagree, either a non-euro leg is driving the index or one of the counts is wrong.
Almost every macro conversation about the dollar starts with the same chart. Traders quote DXY levels the way they quote a stock price, count waves on it, mark Fibonacci retracements on it, and treat it as the measure of dollar strength.
It is a perfectly good instrument to trade. It is a much weaker instrument to reason with, because most people using it have never looked at what is inside it. Once you have, two things change: you stop being surprised when DXY and a specific dollar pair tell different stories, and you gain a structural cross-check on your own counts that costs nothing to run.
What is actually in the index
Six currencies, with fixed weights:
| Currency | Weight | Direction in the formula |
|---|---|---|
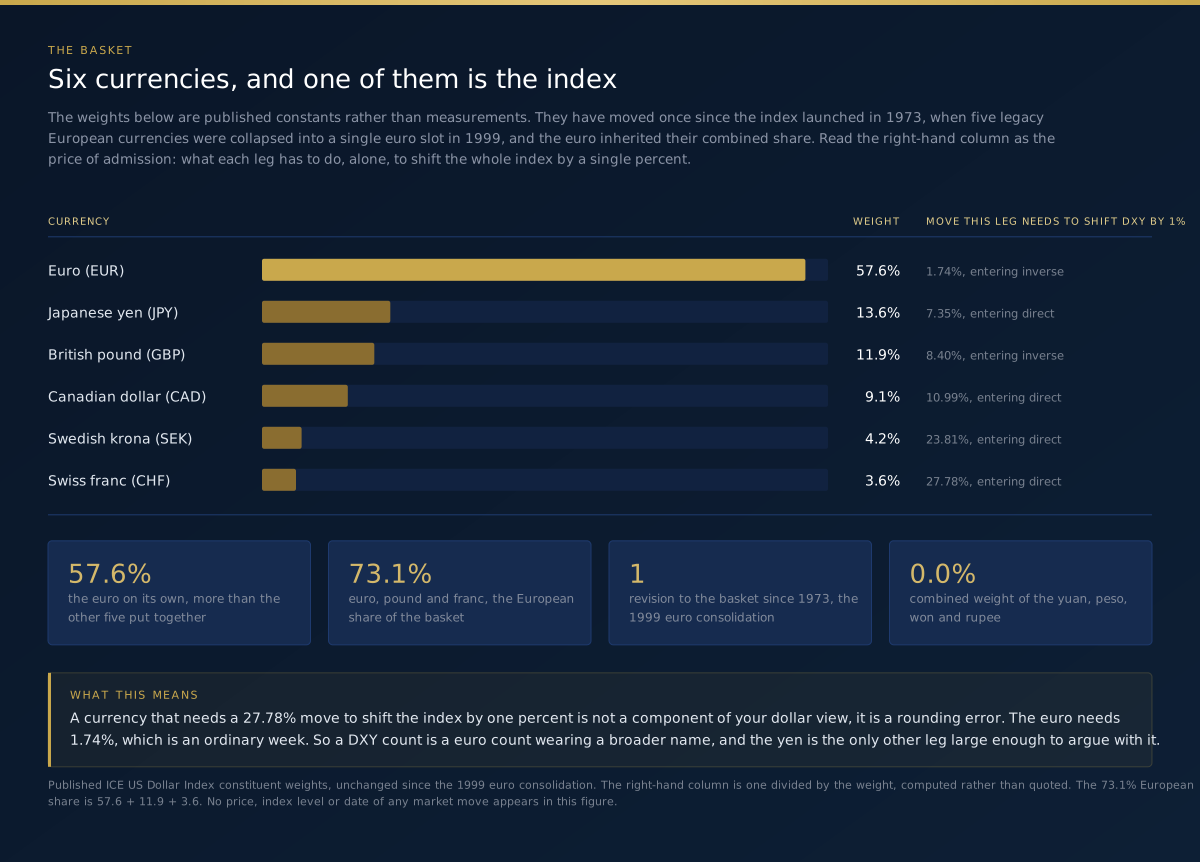
| Euro (EUR) | 57.6% | Inverse: a stronger euro pulls DXY down |
| Japanese yen (JPY) | 13.6% | Direct: a weaker yen pushes DXY up |
| British pound (GBP) | 11.9% | Inverse |
| Canadian dollar (CAD) | 9.1% | Direct |
| Swedish krona (SEK) | 4.2% | Direct |
| Swiss franc (CHF) | 3.6% | Direct |
Two observations follow immediately.
The euro is not a component; it is the index. At 57.6% it outweighs the other five put together. When EURUSD moves half a percent, DXY moves roughly 0.29% from that leg alone before anything else contributes.
European exposure dominates. Euro plus pound plus franc is 73.1%. The dollar index is, to a first approximation, the dollar against Europe, with a meaningful yen overlay and a rounding error of Canada and Sweden.
Why the weights look nothing like current trade
The index was created in 1973, shortly after the Bretton Woods system ended, and the weights were set to reflect the United States' major trading partners at that time. They have been changed exactly once: in 1999, when the German mark, French franc, Italian lira, Dutch guilder and Belgian franc were collapsed into a single euro slot.
Everything else is unchanged. Sweden, a small economy that is not among America's larger trading partners, still holds a 4.2% weight because it did in 1973. Mexico and China have no weight at all, despite both being enormous in US trade today. Neither do South Korea, Taiwan, India or Brazil.
This is not a flaw in the index so much as a property of it. DXY is a continuously comparable series precisely because the basket does not change. A trade-weighted index that reflects current reality has to be re-weighted regularly, which makes long-run technical analysis on it awkward. The Federal Reserve publishes exactly such broad trade-weighted indices, and they are the better tool for questions about the dollar's real-economy value. They are not what you are counting waves on.
Keep the two purposes separate. DXY answers "is the dollar rising against the developed-market currencies traders actually quote?" It does not answer "is the dollar strengthening against the world."
It is a geometric average, not an arithmetic one
Take a constant, multiply it by each exchange rate raised to the power of that rate's weight, and let the sign of the exponent follow how the pair is quoted:
DXY = 50.14348112 × EURUSD⁻⁰·⁵⁷⁶ × USDJPY⁰·¹³⁶ × GBPUSD⁻⁰·¹¹⁹ × USDCAD⁰·⁰⁹¹ × USDSEK⁰·⁰⁴² × USDCHF⁰·⁰³⁶
Two consequences worth knowing.
Because it is geometric, weights act on percentage changes rather than on levels. A 1% move in a component contributes its weight times 1% to the index, regardless of whether that component is trading at 0.9 or 1.6. That is what makes the "57.6% of the move" shorthand approximately correct.
And because it is multiplicative, components can offset each other in ways that produce a flat index over a period in which several individual pairs trended hard. A flat DXY does not mean a quiet dollar. It can equally mean a euro rally cancelling out a yen collapse: two large, tradable moves that leave no trace on the index.
How much does each leg actually move the index?
Because the weights apply to percentage changes, the arithmetic is simple enough to keep in your head. Do it once anyway. The numbers are more lopsided than most traders expect.
| Leg | A 1% move contributes | To move DXY by 1% on its own, this leg must move |
|---|---|---|
| EURUSD | 0.576% | 1.74% |
| USDJPY | 0.136% | 7.35% |
| GBPUSD | 0.119% | 8.40% |
| USDCAD | 0.091% | 10.99% |
| USDSEK | 0.042% | 23.81% |
| USDCHF | 0.036% | 27.78% |
Read the right-hand column carefully. A 1.74% move in the euro, which is an ordinary week, shifts the whole index by a full percent. For the Swiss franc to do the same thing alone would take a move of nearly 28%, which in practice means a currency crisis.
This is why "the dollar index broke resistance" is so often just "the euro broke support" in different clothing. It is also why the Canadian dollar, the krona and the franc are effectively background noise for anything short of a multi-year count. Between them they are 16.9% of the basket. When you are looking for the driver of a DXY move, look at the euro first, the yen second, the pound third, and stop.
The cross-check this gives you for free
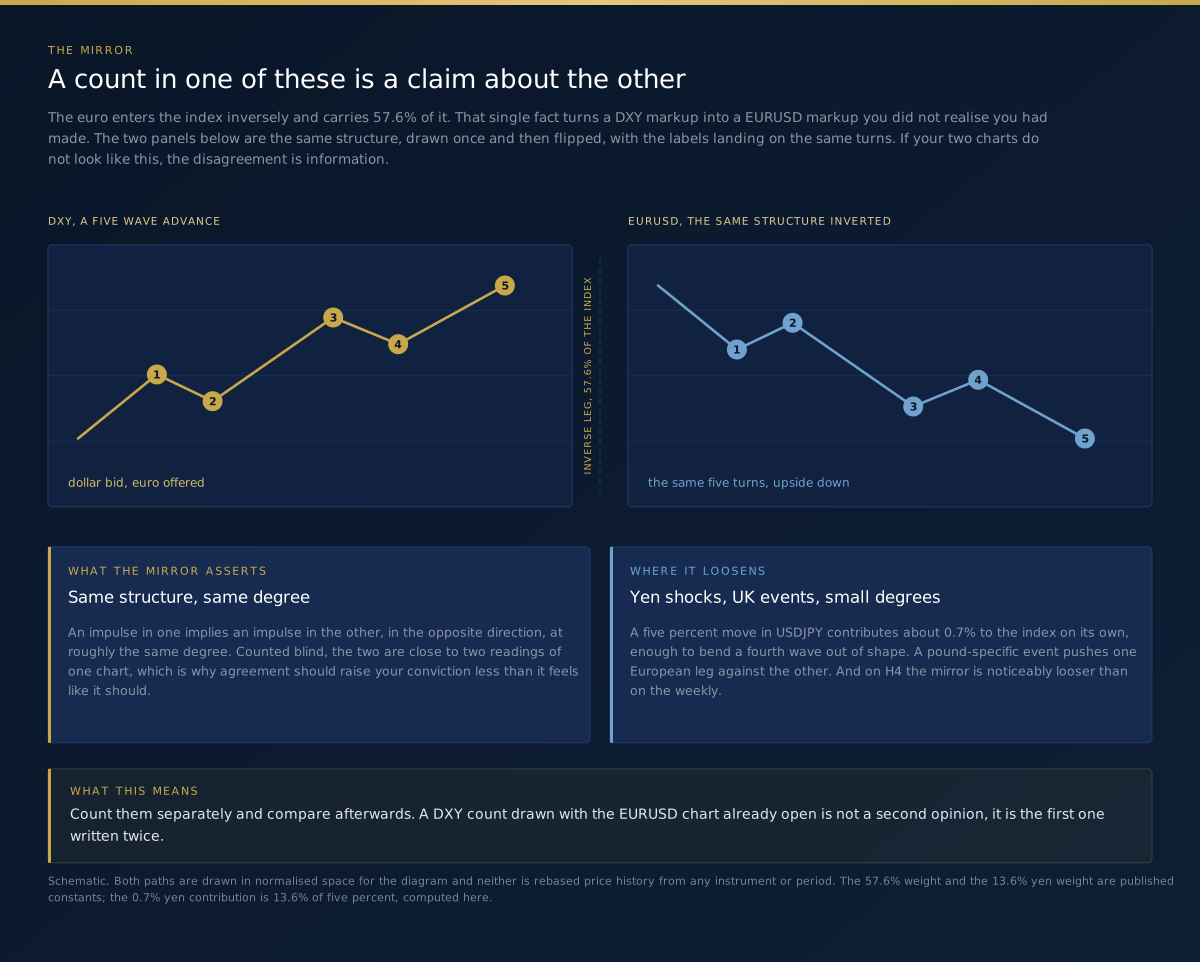
Here is the practical payoff. Because the euro leg dominates and enters inversely, DXY structure and inverted EURUSD structure should look substantially alike. An impulse in one should correspond to an impulse in the other, in the opposite direction, at roughly the same degree.
So run this every time you mark up the dollar index:
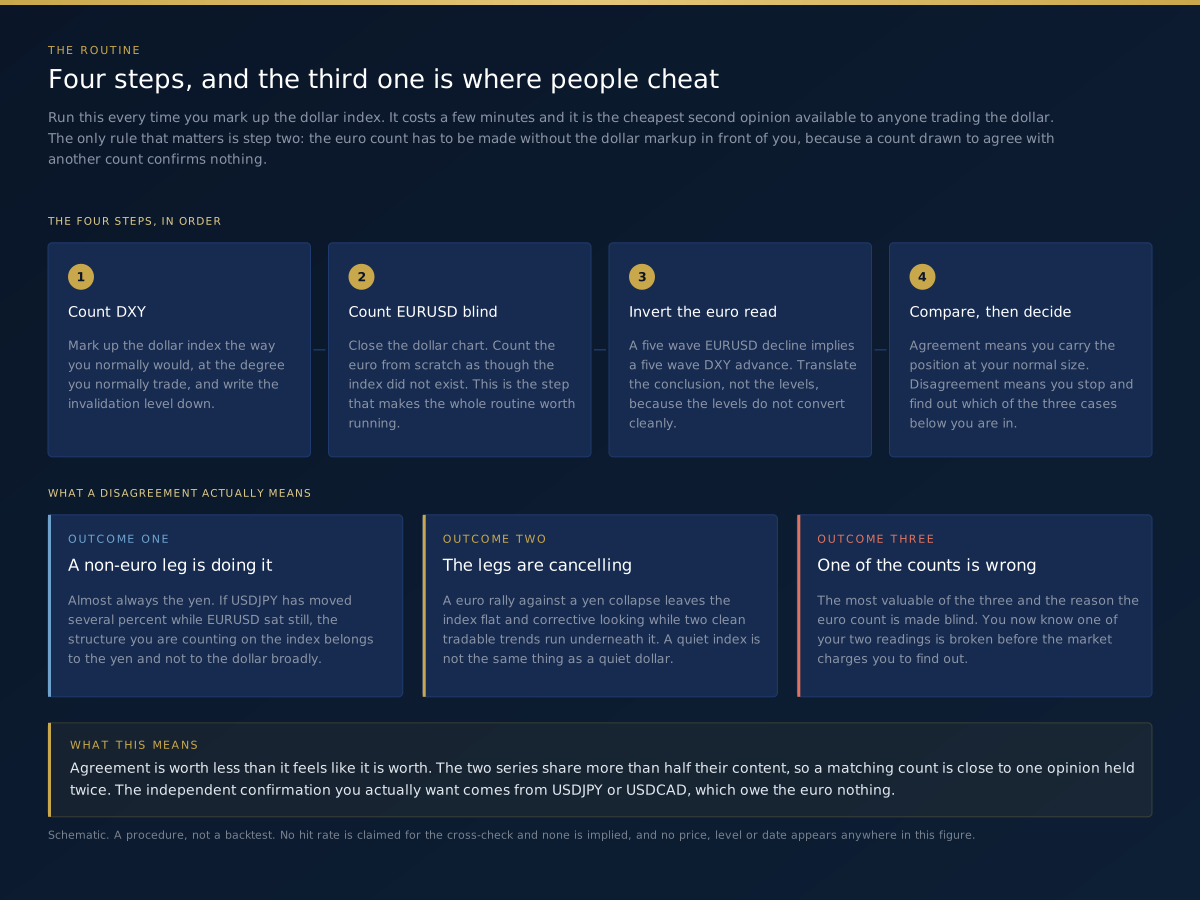
1. Count DXY as you normally would. 2. Open EURUSD and count it independently. Do not look at your DXY markup while you do it. 3. Invert the EURUSD conclusion. A five-wave EURUSD decline implies a five-wave DXY advance. 4. Compare.
When the two agree, you have two independent confirmations of the same structure, and your conviction should be higher. When they disagree, something specific is happening, and it is almost always one of three things:
- A non-euro leg is doing the work. The most common case is a large yen move. Check USDJPY: if it has moved several percent while EURUSD has been quiet, the DXY structure you are seeing belongs to the yen, not to the dollar broadly.
- Offsetting legs. The euro and yen legs are pulling in opposite directions and cancelling. The index is producing a corrective-looking structure that is really an artefact of two clean opposing trends.
- One of your counts is wrong. This is the most valuable outcome, and the reason to do the comparison blind.
Where the mirror breaks down
It is a strong relationship, not an identity. Expect it to loosen in three situations.
Yen shocks. Interventions, policy shifts and carry unwinds move USDJPY violently. At 13.6% the yen is the second-largest leg, and a five percent move contributes about 0.7% to the index on its own. That is enough to distort a fourth wave into something that looks like a failure.
Divergent European policy. The pound and franc are usually correlated with the euro, but not always. A UK-specific event can push the pound leg against the euro leg and blunt the index move.
Small-degree noise. On a four-hour chart the mirror is noticeably less reliable than on a daily or weekly one, because individual legs have their own session-driven microstructure. The higher the degree, the tighter the relationship.
How to fold this into a wave workflow
Choose the instrument that matches the question. If your thesis is about the dollar as a whole, DXY is right. If your thesis is really about European monetary policy, trade EURUSD directly and stop laundering a euro view through a dollar index.
Read a flat index sceptically. Before concluding "the dollar is consolidating," check whether the legs are quiet or whether they are fighting. Those are different market conditions. They resolve differently.
Weight your confirmation properly. DXY confirming a EURUSD count is not fully independent evidence; the two share more than half their DNA. USDJPY or USDCAD confirming it is closer to independent.
Set invalidations on what you trade. If you are executing in EURUSD, your invalidation level belongs on the EURUSD chart. A DXY level converted back into an implied euro level is an approximation you do not need to accept.
Quick facts
- Six currencies; euro 57.6%, yen 13.6%, pound 11.9%, Canadian dollar 9.1%, krona 4.2%, franc 3.6%.
- European currencies together account for 73.1% of the index.
- The basket has been revised once since 1973: the 1999 euro consolidation.
- No Chinese yuan, Mexican peso, Korean won or Indian rupee.
- The calculation is a geometric weighted average, so weights apply to percentage changes.
- A flat DXY can conceal two large offsetting moves in the underlying legs.
- The Federal Reserve's broad trade-weighted dollar indices are the better measure of real-economy dollar strength, and the worse instrument for long-run wave analysis.
Frequently asked questions
Is DXY the same as "the dollar"? No. It is the dollar against six developed-market currencies with weights fixed decades ago. It is a useful, liquid, continuously comparable benchmark, but not a measure of the dollar against the world.
Why is the euro weight so high? Because the 1999 revision merged five separate European currencies into one slot rather than re-weighting the basket. The euro inherited the combined weight of the currencies it replaced.
Does DXY include the Chinese yuan? It does not. That is the single biggest gap between the index and modern US trade patterns, and the main reason analysts reach for a broad trade-weighted index when the question is economic rather than technical.
Can I count waves on DXY at all, given it is a synthetic construction? Yes. Wave analysis needs a liquid, continuously priced series that reflects collective positioning, and DXY qualifies on all three counts. Just remember what the crowd on the other side of it is actually trading.
If DXY is mostly EURUSD, why not trade EURUSD instead? Often you should. The index earns its place when you want a single instrument expressing a broad dollar view, when you want a cleaner-looking chart than any single pair provides, or when you are using it as a confirming series rather than an execution vehicle.
What is the constant 50.14348112 for? It sets the index to 100 at its March 1973 base. It carries no analytical meaning: it exists only to anchor the scale.
START WITH THE STRUCTURE. EW Strategy publishes daily Elliott Wave analysis across 27 instruments, DXY and all eleven major FX pairs among them, on H4, Daily and Weekly. Annotated PDF reports, and EWS Helix on WhatsApp when you want a second read at two in the morning.
Further reading
Frequently asked questions
What is Elliott Wave analysis?+
Elliott Wave analysis is a form of technical analysis based on the theory that financial markets move in predictable wave patterns reflecting crowd psychology. Markets advance in five-wave impulse patterns and correct in three-wave patterns.
How accurate is Elliott Wave analysis?+
Accuracy depends on the analyst's skill, the instrument, and how the result is measured. At EW Strategy, every published call carries a direction, target levels and an invalidation level stated in advance, and every outcome is recorded against them. We are rebuilding that record from the raw archive under a measurement rule published before any figure, and we would rather show nothing than a headline number we cannot defend.
Can Elliott Wave analysis be used for day trading?+
Yes. Elliott Wave patterns appear at all timeframes, from 1-minute charts to monthly charts. Day traders typically focus on sub-minuette and minuette degree waves for intraday setups.
Elliott Wave analyst with 15+ years of experience. Covers 27 instruments daily across Forex, Commodities, Indices and Crypto. Founder of Artavest Oy, Helsinki.