GBPUSD Elliott Wave: Waiting for 1.3492-1.3508 to Sell
A good trader is like a hunter. Most of the job is waiting quietly in the right spot.
A good trader is like a hunter. Most of the job is waiting quietly in the right spot, not chasing every candle that moves.
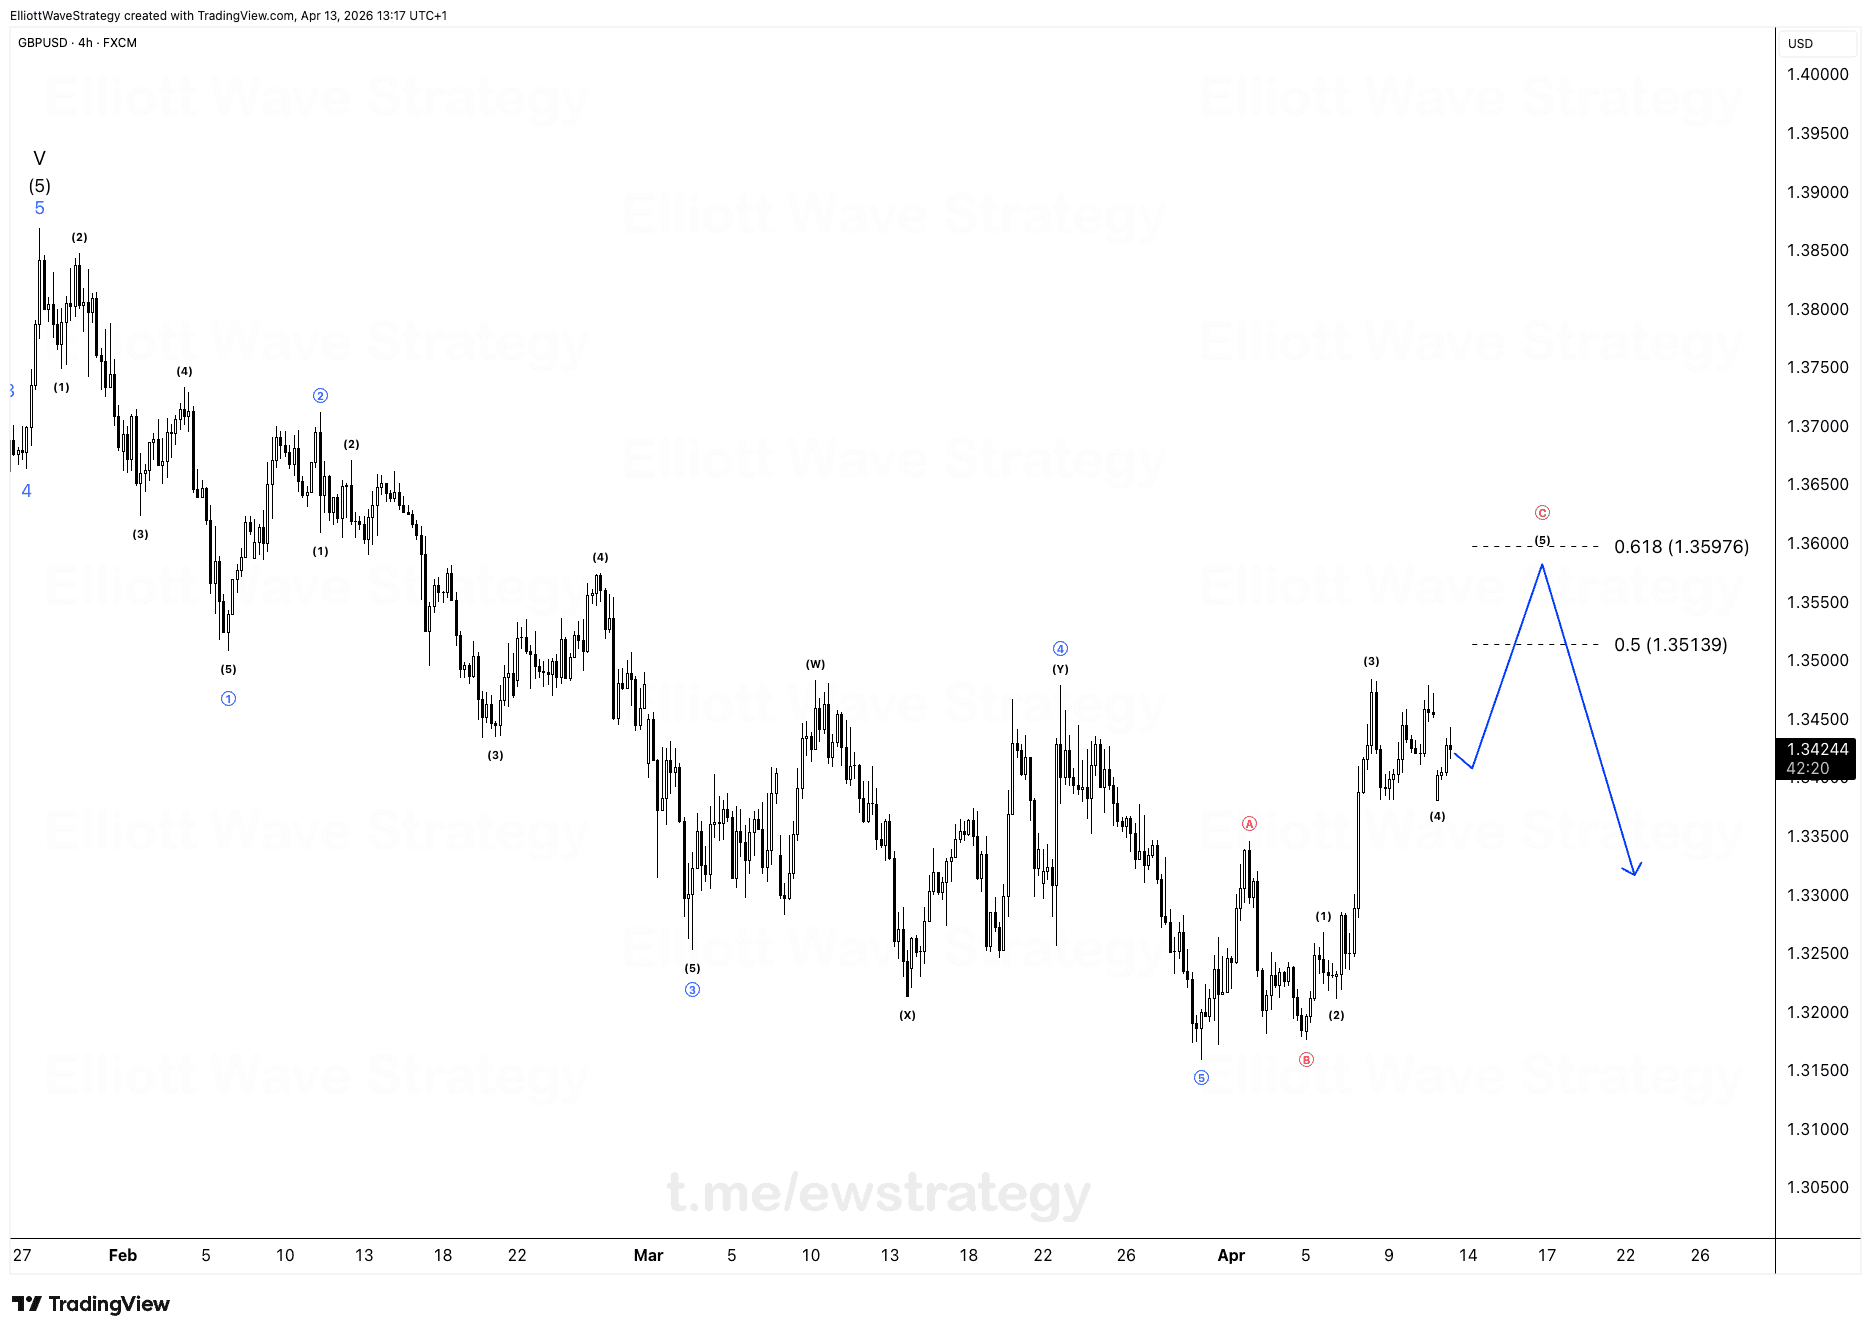
GBPUSD just gave a clean example of why that matters. Wave (c) of X topped out right at the invalidation level, 1.35579. Price has been carving out a corrective pullback since that top, and it's now closing in on the 0.5 to 0.618 retracement zone, between 1.34920 and 1.35075.
Why does wave (c) of X matter here
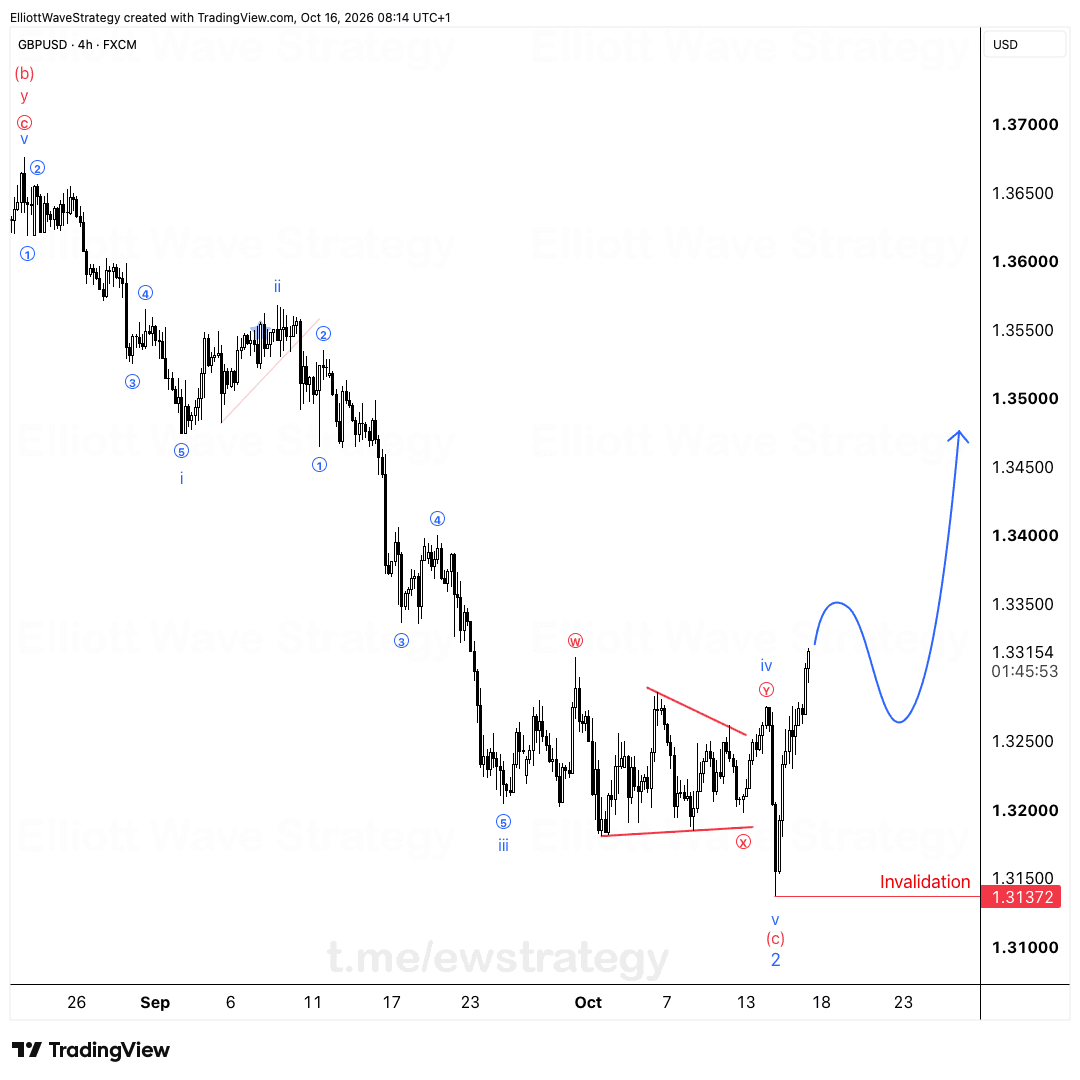
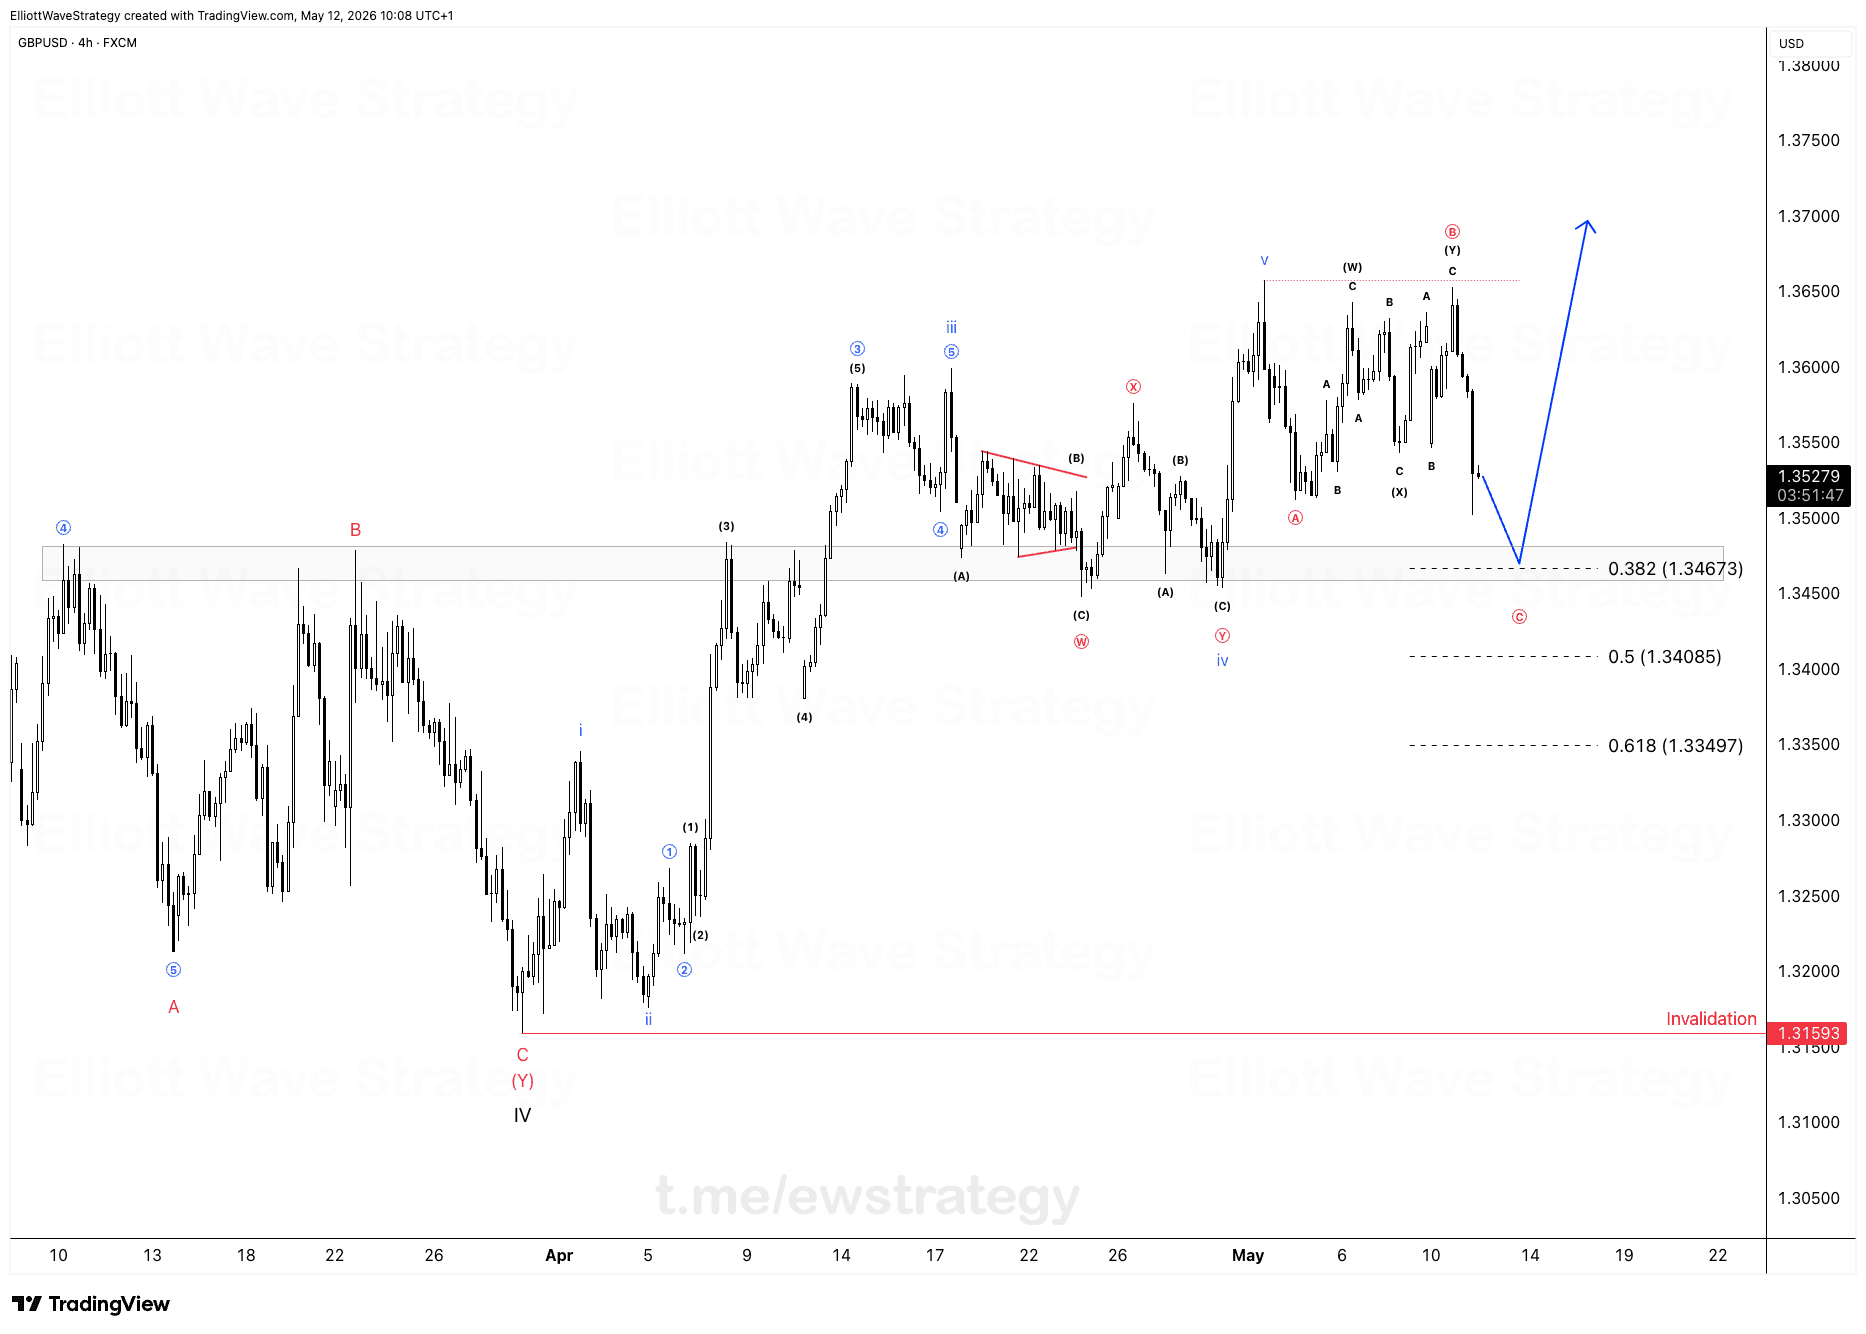
The count on the 4 hour chart shows a W-X-Y style corrective sequence. Wave W finished as a zigzag down into late June, labeled (y) of W with waves a, b, c inside it. From there the market built an impulsive move up, five waves labeled i through v, followed by an (a)-(b)-(c) structure that pushed price into a contracting triangle around 1.335 to 1.345.
That triangle resolved higher, and wave (c) of X extended straight into 1.35579. That price is not random. It's the invalidation level for the entire bullish count. Price topping exactly there tells you the structure respected its boundary instead of blowing through it, which keeps the bearish scenario alive.
What happens at the 1.34920 to 1.35075 zone
This pullback since the top isn't just some drift lower. It's the retracement the count wants before the next leg down can play out. The 0.5 retracement sits at 1.34920, the 0.618 sits at 1.35075. That zone is where a corrective bounce would naturally lose steam if wave X has truly finished.
If price respects this zone and turns back down, that opens the door for a move back toward 1.32. That target lines up with the drawn trajectory on the chart, a decline that would retrace a big chunk of the advance from wave ii on the daily structure.
What invalidates this GBPUSD bearish view
The invalidation is simple: 1.35579. A close above that level breaks the idea that wave (c) of X has topped, and the whole corrective count needs to be reworked. Below that price, the zigzag lower toward 1.32 stays on the table.
Reading structure versus watching candles
That's the difference between watching charts and reading them. Anyone can stare at candles as they print. Reading structure means you already know which zone you're hunting in before price even gets there.
We're not chasing this move lower. We're letting it come to us. The 1.34920 to 1.35075 zone is the spot. What price does when it arrives there tells the next part of the story.
Key Takeaways
- •GBPUSD topped wave (c) of X right at the 1.35579 invalidation level.
- •The current GBPUSD pullback is targeting the 0.5-0.618 retracement zone between 1.34920 and 1.35075.
- •A turn in that zone would open the door for GBPUSD to move back toward 1.32.
- •A close above 1.35579 invalidates the bearish Elliott Wave count on GBPUSD.
- •The structure shows a W-X-Y correction with a contracting triangle preceding the rally into wave (c).
Frequently Asked Questions
What invalidates the bearish GBPUSD Elliott Wave count?
A close above 1.35579 invalidates the count, since that level marks the top of wave (c) of X and the boundary the bearish structure depends on.
Why is the 0.5-0.618 zone important for GBPUSD right now?
That zone, between 1.34920 and 1.35075, is the expected retracement area for the pullback following wave (c) of X. A turn there would support the case for a decline toward 1.32.
What is the downside target if GBPUSD turns lower from this zone?
The chart's drawn projection points toward 1.32 as the next leg down if price respects the 0.5-0.618 retracement and reverses.
Disclaimer: This analysis is for educational purposes only and does not constitute financial advice. Elliott Wave analysis involves subjective interpretation. Always do your own research and manage your risk accordingly.
Get Full Coverage for All 27 Instruments
Premium members receive daily wave counts with entry zones, targets and invalidation levels, published daily across all 27 instruments.
View Premium Plans