USDJPY Elliott Wave: Triangle in Wave (iv) Points to New Highs
Most traders look at a pullback and feel fear. Wave traders look at the same pullback and see a setup building. The chart never changed. The eyes did.
Most traders look at a pullback and feel fear. Wave traders look at the same pullback and see a setup building. The chart never changed. The eyes did.
USDJPY has spent weeks grinding sideways on the 4h chart, and every candle of that grind looks like hesitation to anyone reading price without a wave count. But structure tells a different story. What looks like indecision is actually wave (iv) doing exactly what a correction is supposed to do.
What does the wave (iv) triangle mean for USDJPY?
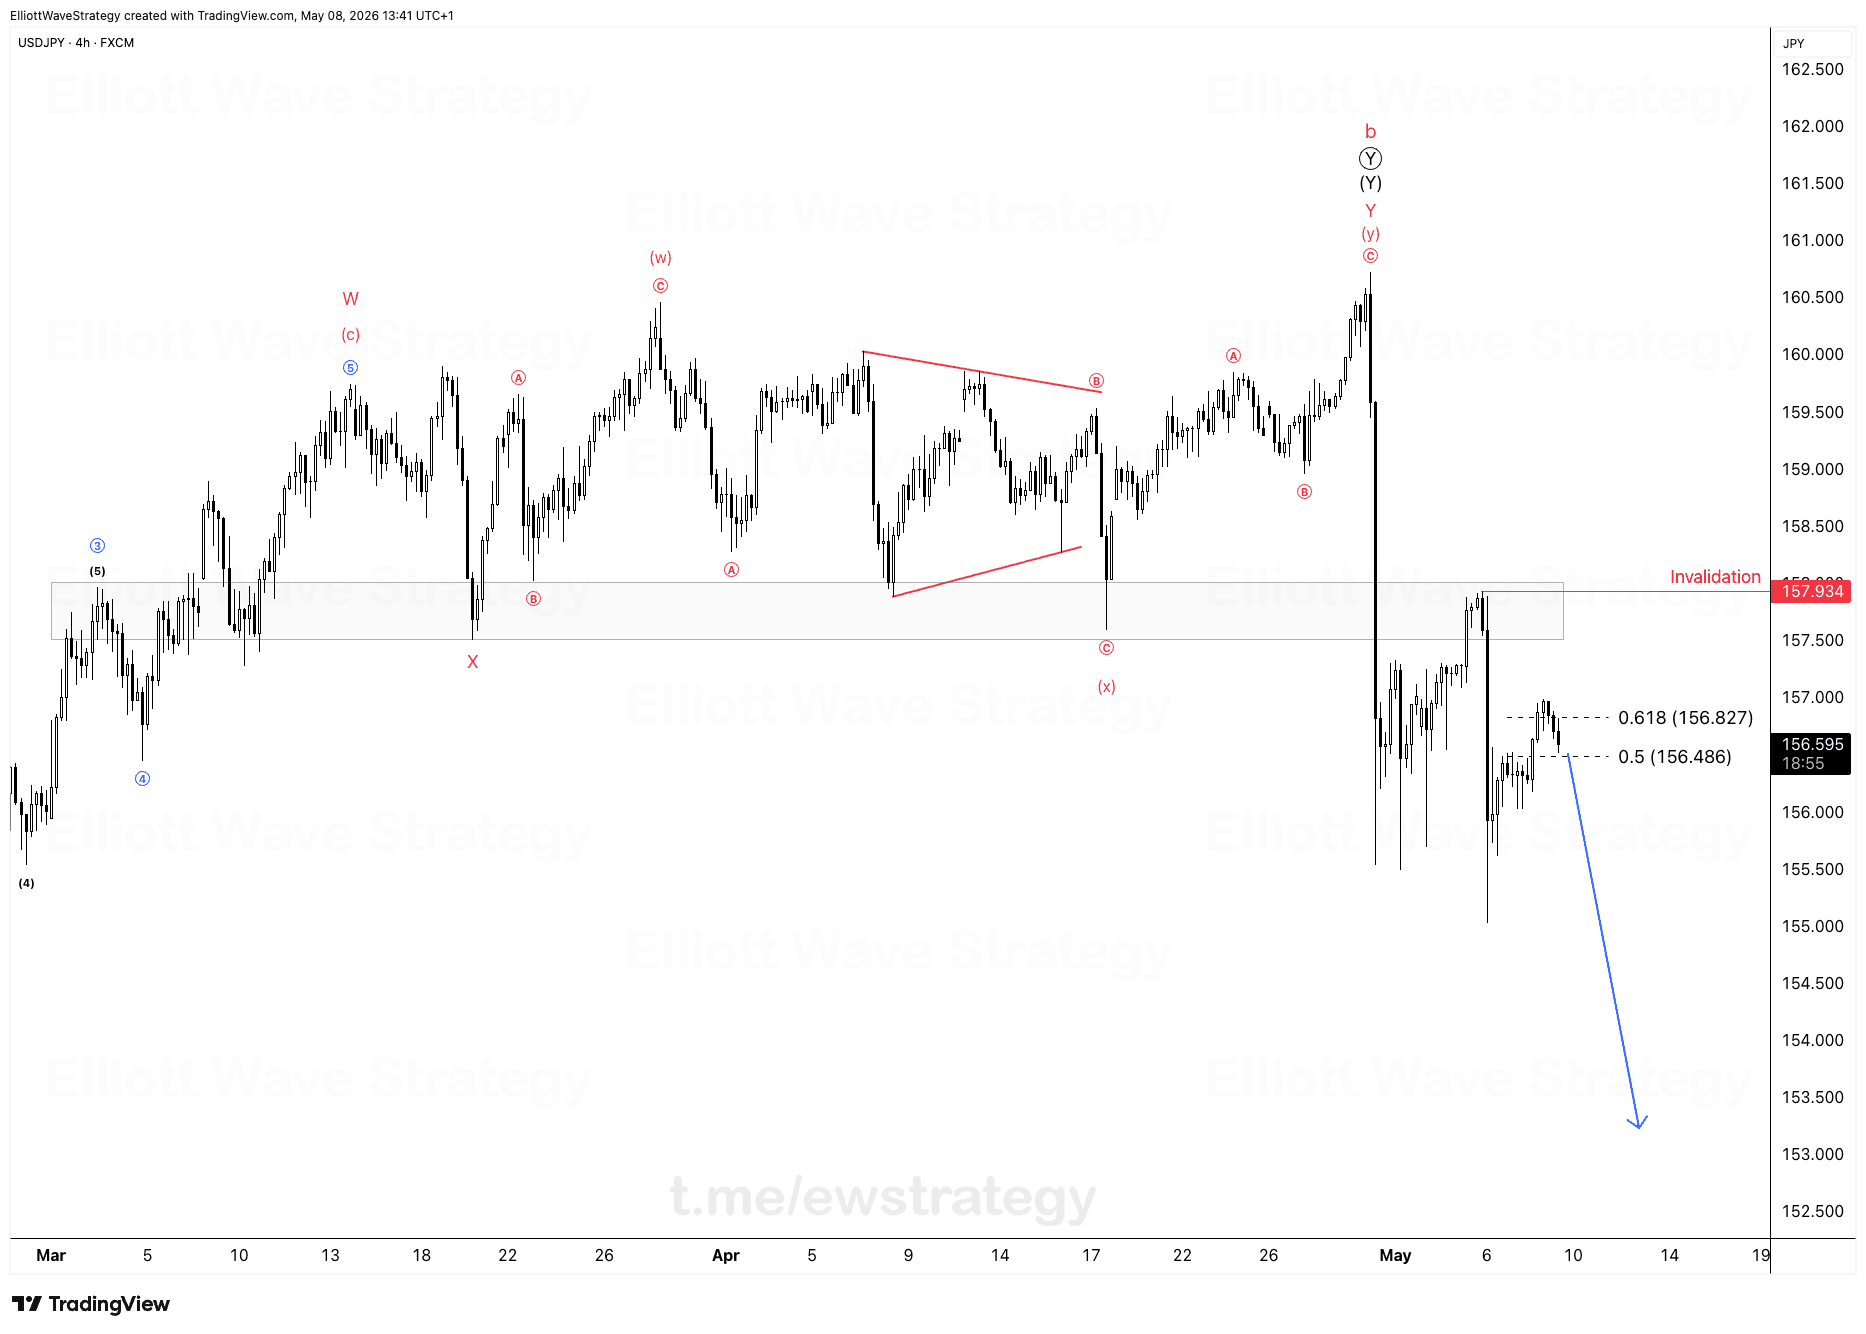
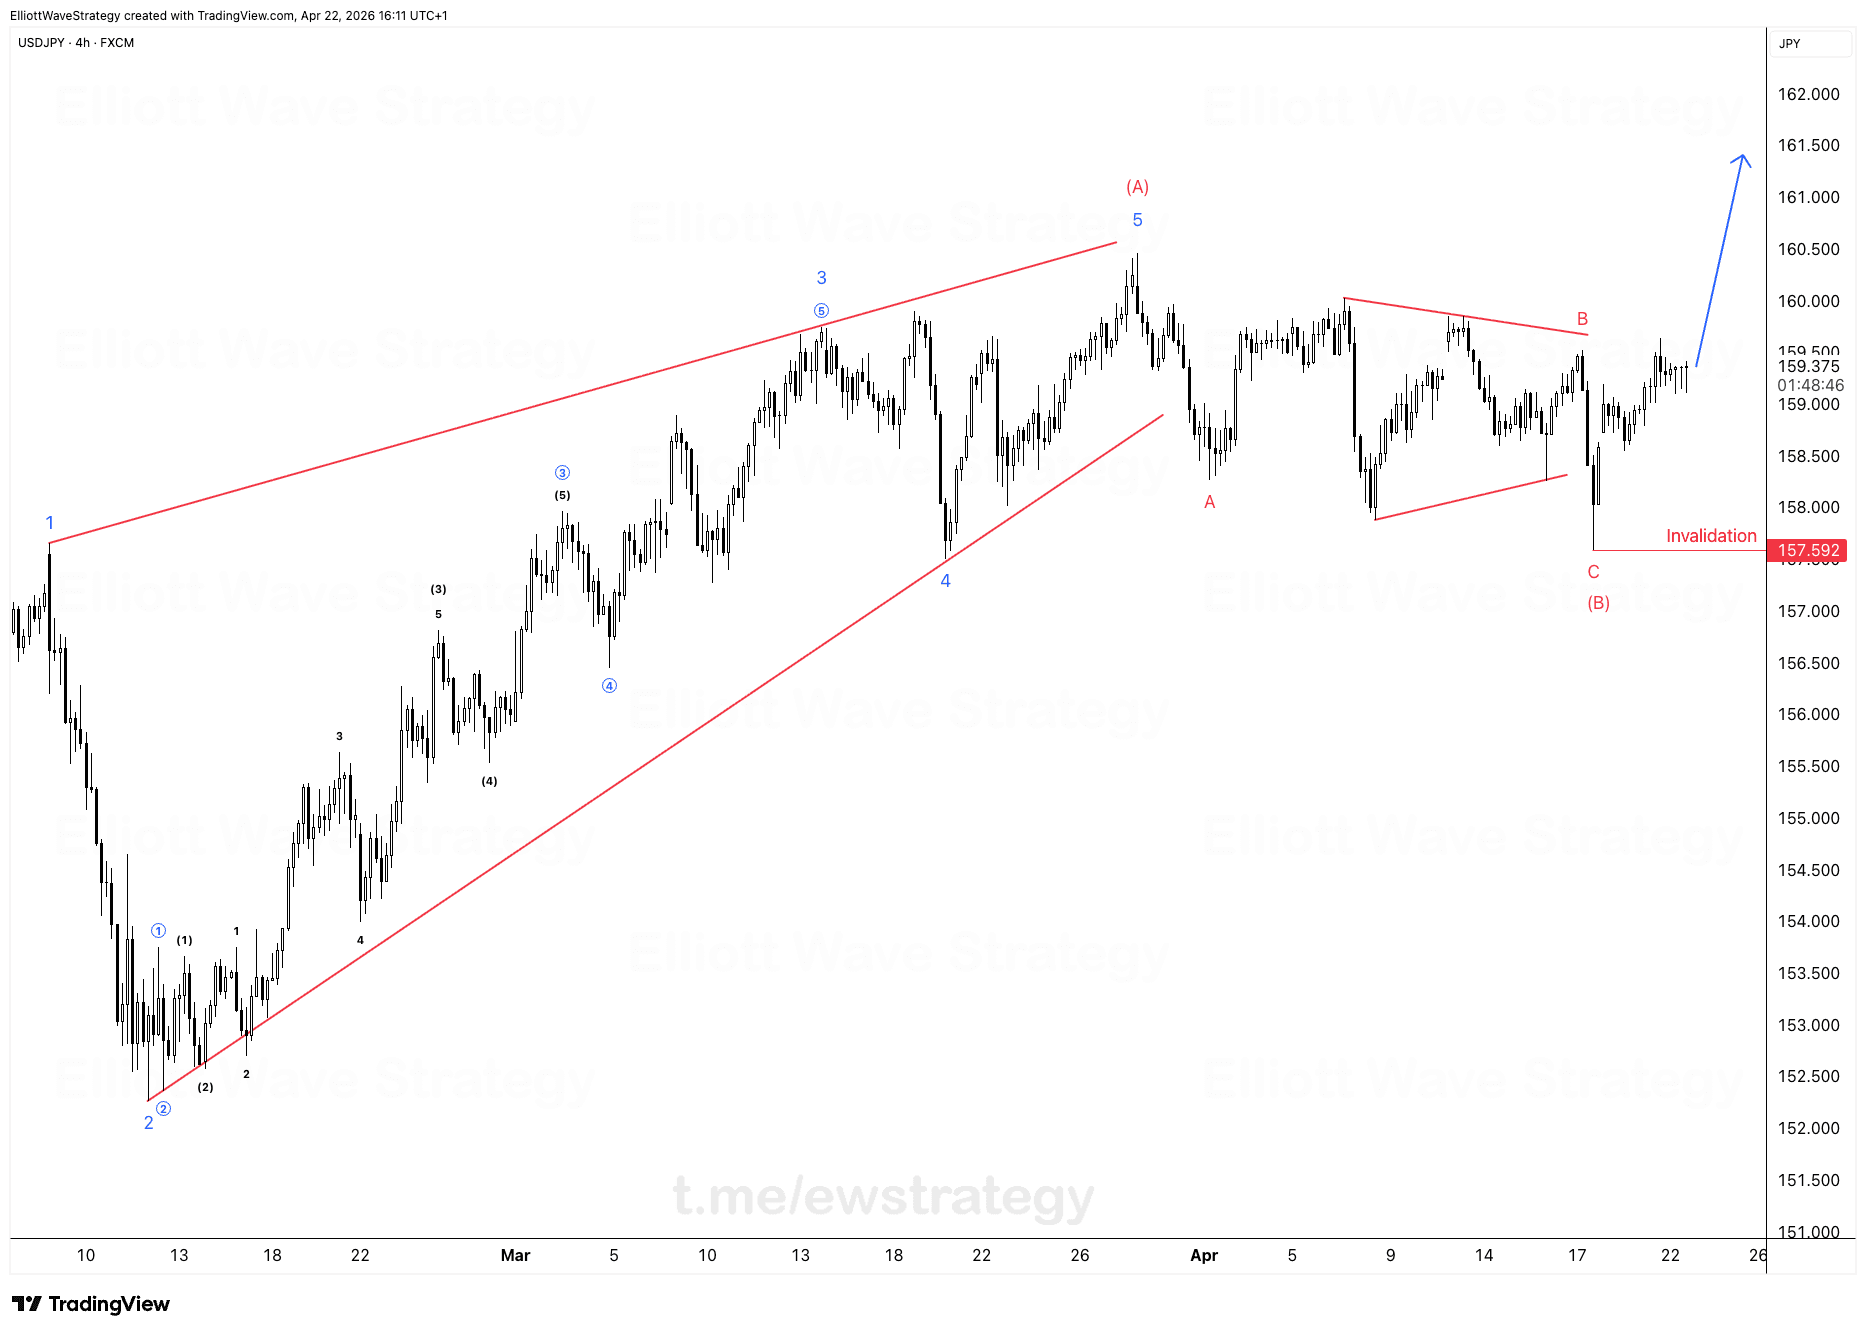
Wave (iv) has completed its corrective triangle right on structure. You can see it on the chart: price bounces between two converging trendlines, higher lows on one side, lower highs on the other, squeezing tighter with every touch.
That contraction is not random chop. The contracting pattern between the trendlines did its job. It compressed price, tested patience, and now leaves the door open for wave (v) to extend higher.
This fits cleanly into the bigger picture already printed on the chart. Wave 4 finished with a zigzag down into the low near 159.5, then wave ① through wave ⑤ built a clean five-wave impulse up into the wave iii high above 163. Wave (iv) is simply the fourth wave of that fifth wave, unfolding one degree smaller.
Where does the bullish USDJPY count get invalidated?
Invalidation sits at 161.603. As long as that holds, the structure calling for a final push up into new highs stays intact.
That number is not arbitrary. It sits right at the lower boundary of the triangle, the same trendline that has supported every dip since the correction began. A break below it would mean the triangle failed to hold as a fourth wave, and the whole wave (v) case falls apart with it.
Until that happens, the drawn projection on the chart shows wave (v) extending toward the 163.50 to 164.00 area, continuing the impulse that started back at wave i.
Why do most traders misread a triangle like this?
A sideways range with no clear direction feels uncomfortable. Price stalls, momentum dries up, and the instinct is to assume the trend is over.
But triangles are one of the most reliable fourth wave patterns in Elliott Wave theory precisely because they test that instinct. They chop out the traders who need constant movement to stay confident, then release in the direction of the larger trend once the pattern completes.
Same chart, different eyes.
USDJPY right now is a clean example of that idea. The triangle looks like stagnation to one trader and a coiled spring to another, and the only thing separating the two readings is whether you're counting waves or just watching candles.
The structure stays valid above 161.603. Below it, the count needs a rethink, but as it stands, the pattern points toward one more leg higher before this impulse from wave i is complete.
Key Takeaways
- •USDJPY has completed a wave (iv) contracting triangle just above the 161.603 invalidation level.
- •The triangle in USDJPY compressed price for weeks before leaving room for wave (v) to extend higher.
- •Invalidation for the bullish USDJPY Elliott Wave count sits at 161.603, right at the triangle's lower trendline.
- •The drawn projection on the USDJPY chart targets the 163.50 to 164.00 area for wave (v).
- •A break below 161.603 would invalidate the current wave (iv) triangle count on USDJPY.
Frequently Asked Questions
What invalidates the bullish USDJPY Elliott Wave count?
The count is invalidated if price closes below 161.603, which is the lower boundary of the wave (iv) contracting triangle. A break there would mean the triangle failed as a fourth wave and the wave (v) projection no longer applies.
What does the wave (iv) triangle on USDJPY suggest about wave (v)?
A completed contracting triangle in the fourth wave position typically precedes a final thrust in the direction of the larger trend. On USDJPY, that means wave (v) is expected to extend higher, projected toward 163.50 to 164.00 while 161.603 holds.
Why do traders confuse a corrective triangle with trend exhaustion?
Triangles produce sideways, low-momentum price action that feels like the trend has stalled. In Elliott Wave terms it's usually the opposite, a triangle compresses volatility before releasing in the direction of the prior trend.
Disclaimer: This analysis is for educational purposes only and does not constitute financial advice. Elliott Wave analysis involves subjective interpretation. Always do your own research and manage your risk accordingly.
Get Full Coverage for All 27 Instruments
Premium members receive daily wave counts with entry zones, targets and invalidation levels, published daily across all 27 instruments.
View Premium Plans