GBPJPY Elliott Wave: Wave 4 Bounce Before Final Drop
Wave 3 of (5) is done. Wave 4 is building now.
Wave 3 of (5) is done on GBPJPY. Wave 4 is building now.
We shared the bigger picture earlier this week. Now we're watching how the structure plays out on the 4h chart, and so far it's behaving exactly like a Wave 4 should.
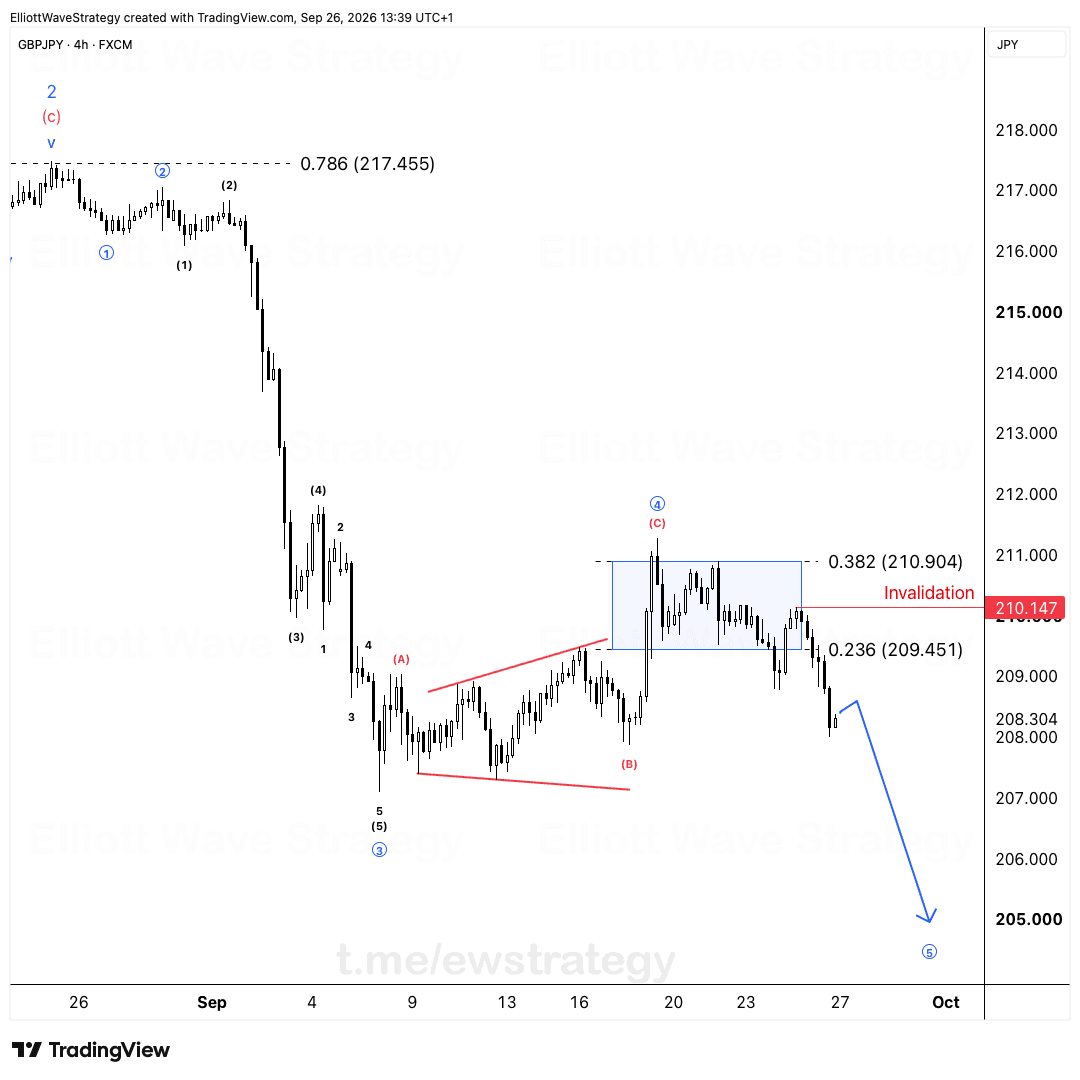
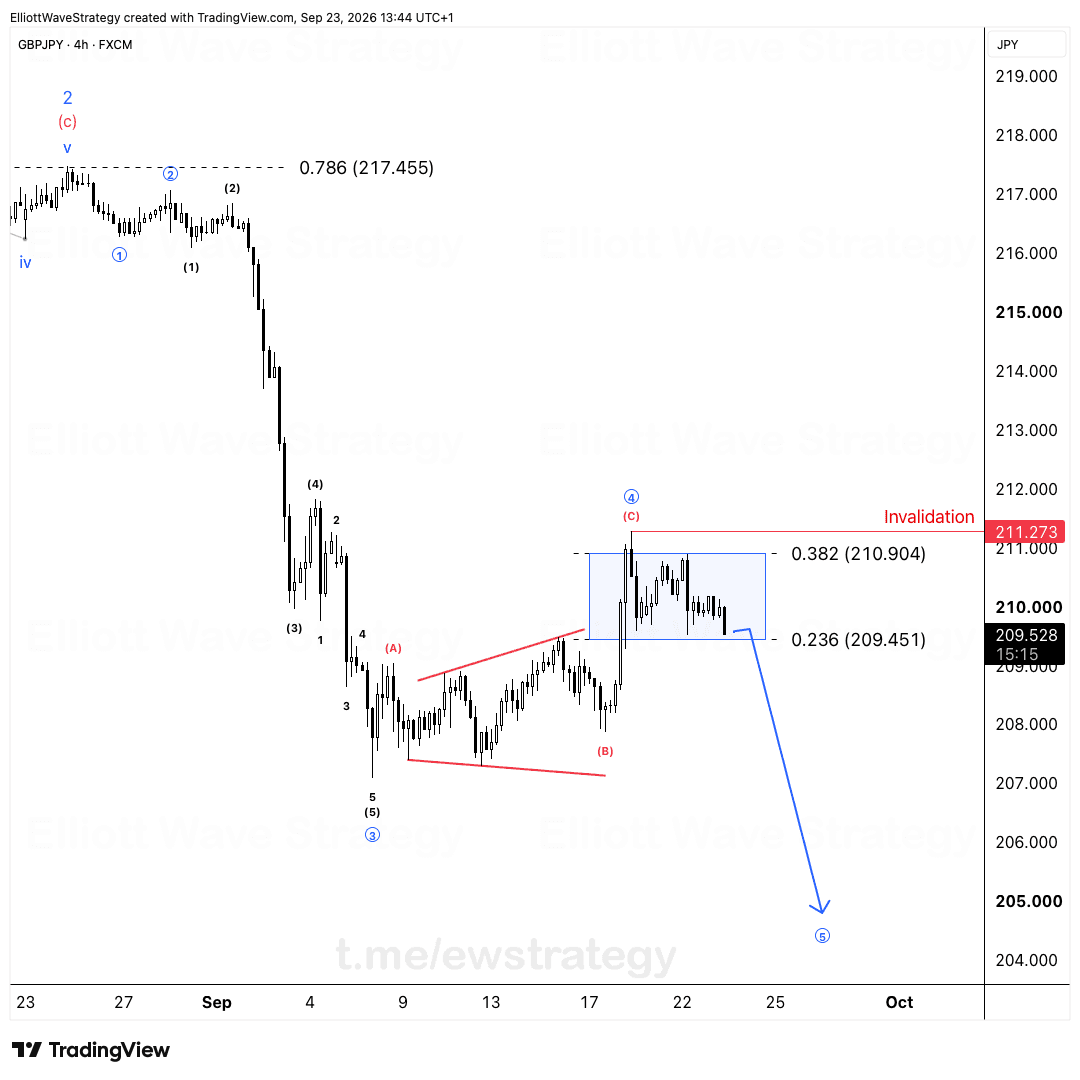
Price should correct between the 0.236 and 0.382 Fib levels before the next leg lower kicks in for Wave 5 of (5). This isn't a reversal signal. The market is pausing inside a larger bearish cycle that started from Wave (v) at the top, all the way back where the red (b) wave labels mark the prior high.
Why is GBPJPY bouncing after such a sharp drop?
Look at what came before this bounce. Wave 3 dropped hard, ending near 207.428, and inside that drop we can count five sub-waves down to (5) of the blue wave 3. That's the kind of move that empties out momentum fast.
After a wave that steep, a correction isn't optional. It's mechanical. Wave 4 exists specifically to absorb the leftover selling pressure and rebalance the market before the final wave in the sequence.
A correction isn't wasted time. It's the market getting ready for the next move.
Where does the Wave 4 bounce end on GBPJPY?
The chart marks two Fibonacci retracement zones for this bounce: the 0.236 level near 208.744 and the 0.382 level higher up. The blue arrow on the chart draws the expected path, curling up into that shaded zone between the two levels before turning back down.
This lines up with how Wave 4s typically behave after a strong Wave 3. They retrace a modest portion of the prior decline, usually shallower than Wave 2, and then hand control back to the trend.
The drop into Wave 3 already showed this pattern once before, on a smaller scale. After wave ①'s rally into the 0.618 retracement near 215.768 and the 0.786 level near 217.455, wave ② corrected before wave ③ took over and drove price sharply lower into wave (5). Wave 4 now is the same behavior playing out one degree higher.
What happens after the Wave 4 correction completes?
Once the bounce finishes inside the 0.236 to 0.382 zone, the count calls for Wave 5 of (5) to begin. This would be the final impulsive leg down in this bearish cycle, extending below the Wave 3 low near 207.428.
Amateurs see the bounce and think the selling is over. We see Wave 4 doing exactly what Wave 4s do: testing patience before the final push down.
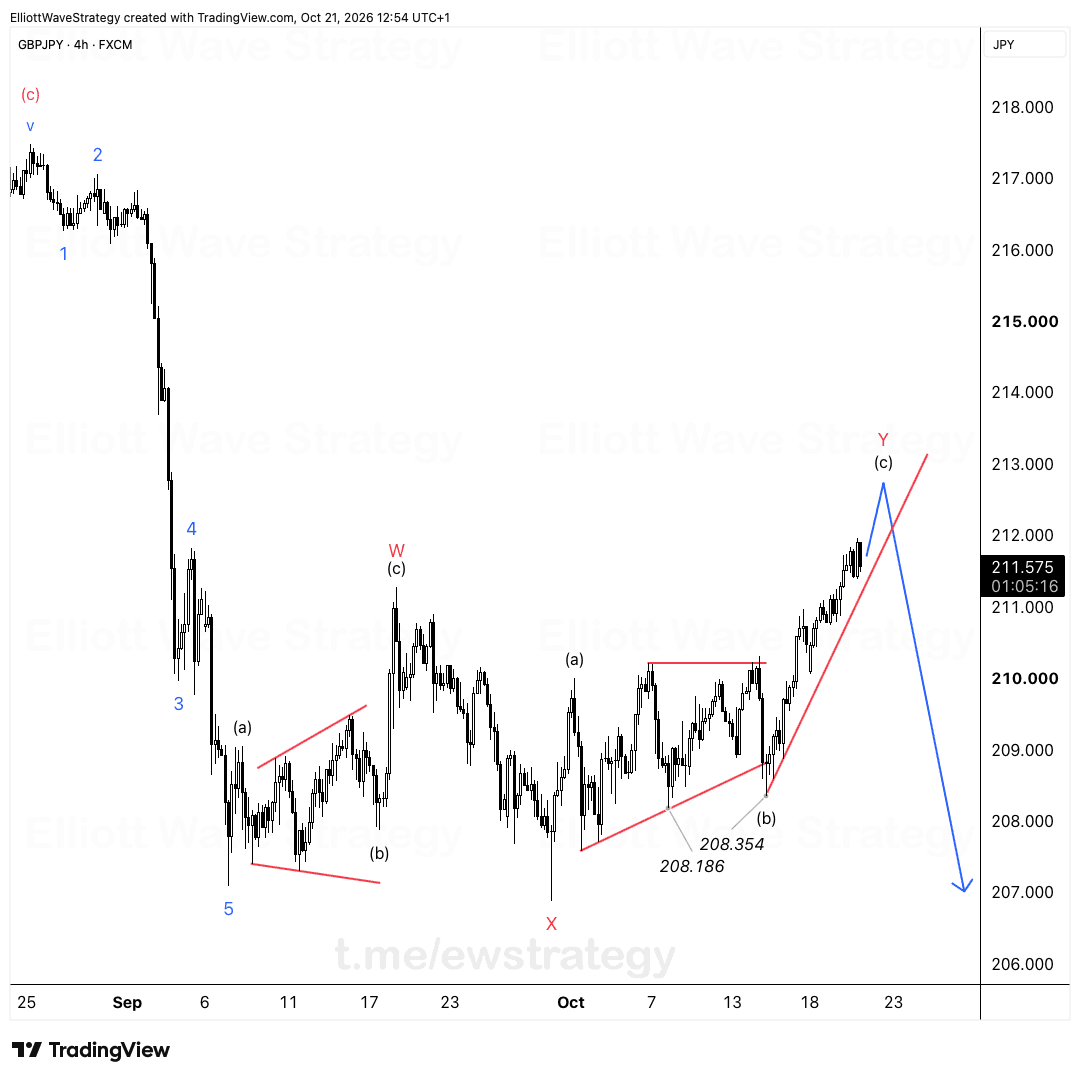
The bigger structure hasn't changed. The (5) wave down from the top, which itself contains this entire 1 through 5 sequence, is still incomplete until Wave 5 finishes its work.
The correction into Wave 4 is a pause built into the structure, not evidence the bearish cycle is over. GBPJPY traders watching this chart should treat the bounce as context, not confirmation of a trend change. Wave 5 of (5) remains the expected next move once the retracement completes inside the 0.236 to 0.382 zone.
Key Takeaways
- •GBPJPY completed Wave 3 of (5) with a sharp decline into the 207.428 area.
- •The current bounce in GBPJPY is Wave 4, expected to retrace between the 0.236 and 0.382 Fibonacci levels.
- •Wave 4 on GBPJPY is a pause inside a larger bearish cycle, not a trend reversal signal.
- •Once Wave 4 completes, the Elliott Wave count calls for Wave 5 of (5) to push GBPJPY lower.
- •The Wave 2 correction earlier in this GBPJPY sequence, retracing to the 0.618 and 0.786 levels, showed the same pause-before-continuation behavior now expected in Wave 4.
Frequently Asked Questions
What would invalidate the bearish GBPJPY Wave 4 count?
If price pushes well beyond the 0.382 retracement and starts overlapping deep into the prior Wave 3 territory, the Wave 4 labeling would need to be reconsidered, since Wave 4s typically stay shallow relative to Wave 3.
Is the GBPJPY bounce a buy signal?
No. The bounce is being read as a Wave 4 correction inside a larger bearish cycle, not a change in trend, so it is not being presented as a trade signal.
What comes after Wave 4 on GBPJPY?
According to the count, Wave 5 of (5) follows, which would be the final impulsive leg lower extending below the prior Wave 3 low near 207.428.
Disclaimer: This analysis is for educational purposes only and does not constitute financial advice. Elliott Wave analysis involves subjective interpretation. Always do your own research and manage your risk accordingly.
Get Full Coverage for All 27 Instruments
Premium members receive daily wave counts with entry zones, targets and invalidation levels, published daily across all 27 instruments.
View Premium Plans