GBPUSD Elliott Wave: Wave 2 Low In at 1.3137?
Cable broke below the range low on Wednesday, hit 1.3137 and reversed straight back up. I count that spike as the end of wave 2, with the sideways range before
Cable broke below the range low on Wednesday, hit 1.3137 and reversed straight back up. Most traders saw a failed breakdown. I count that spike as the end of wave 2.
The move did what stop hunts always do. It took out the obvious low, cleared the late sellers, and left the market with nothing underneath it.
Why does the 1.3137 spike mark the end of wave 2?
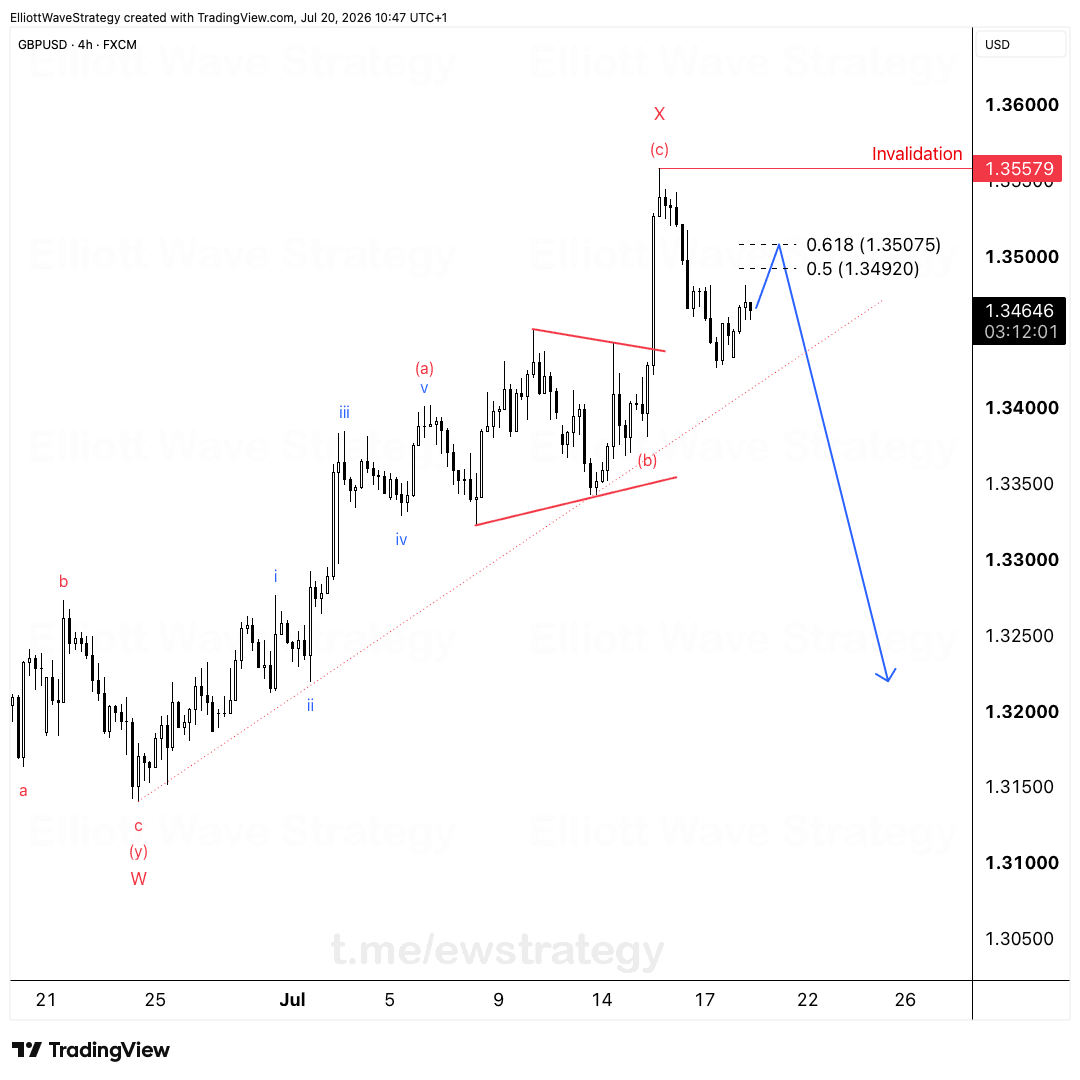
The sideways range before the spike is the correction inside wave (c). I label it as a WXY: wave (w) at the top of the range, wave (x) at the range low, wave (y) as the final push before the break. That is a classic flat, overlapping structure, the kind that drags on and bores everyone out.
Then the break. Price dropped below the range low, touched 1.3137, and snapped back. Wave v of (c) is the final leg, and it ended with that spike. With (c) done, wave 2 is done.
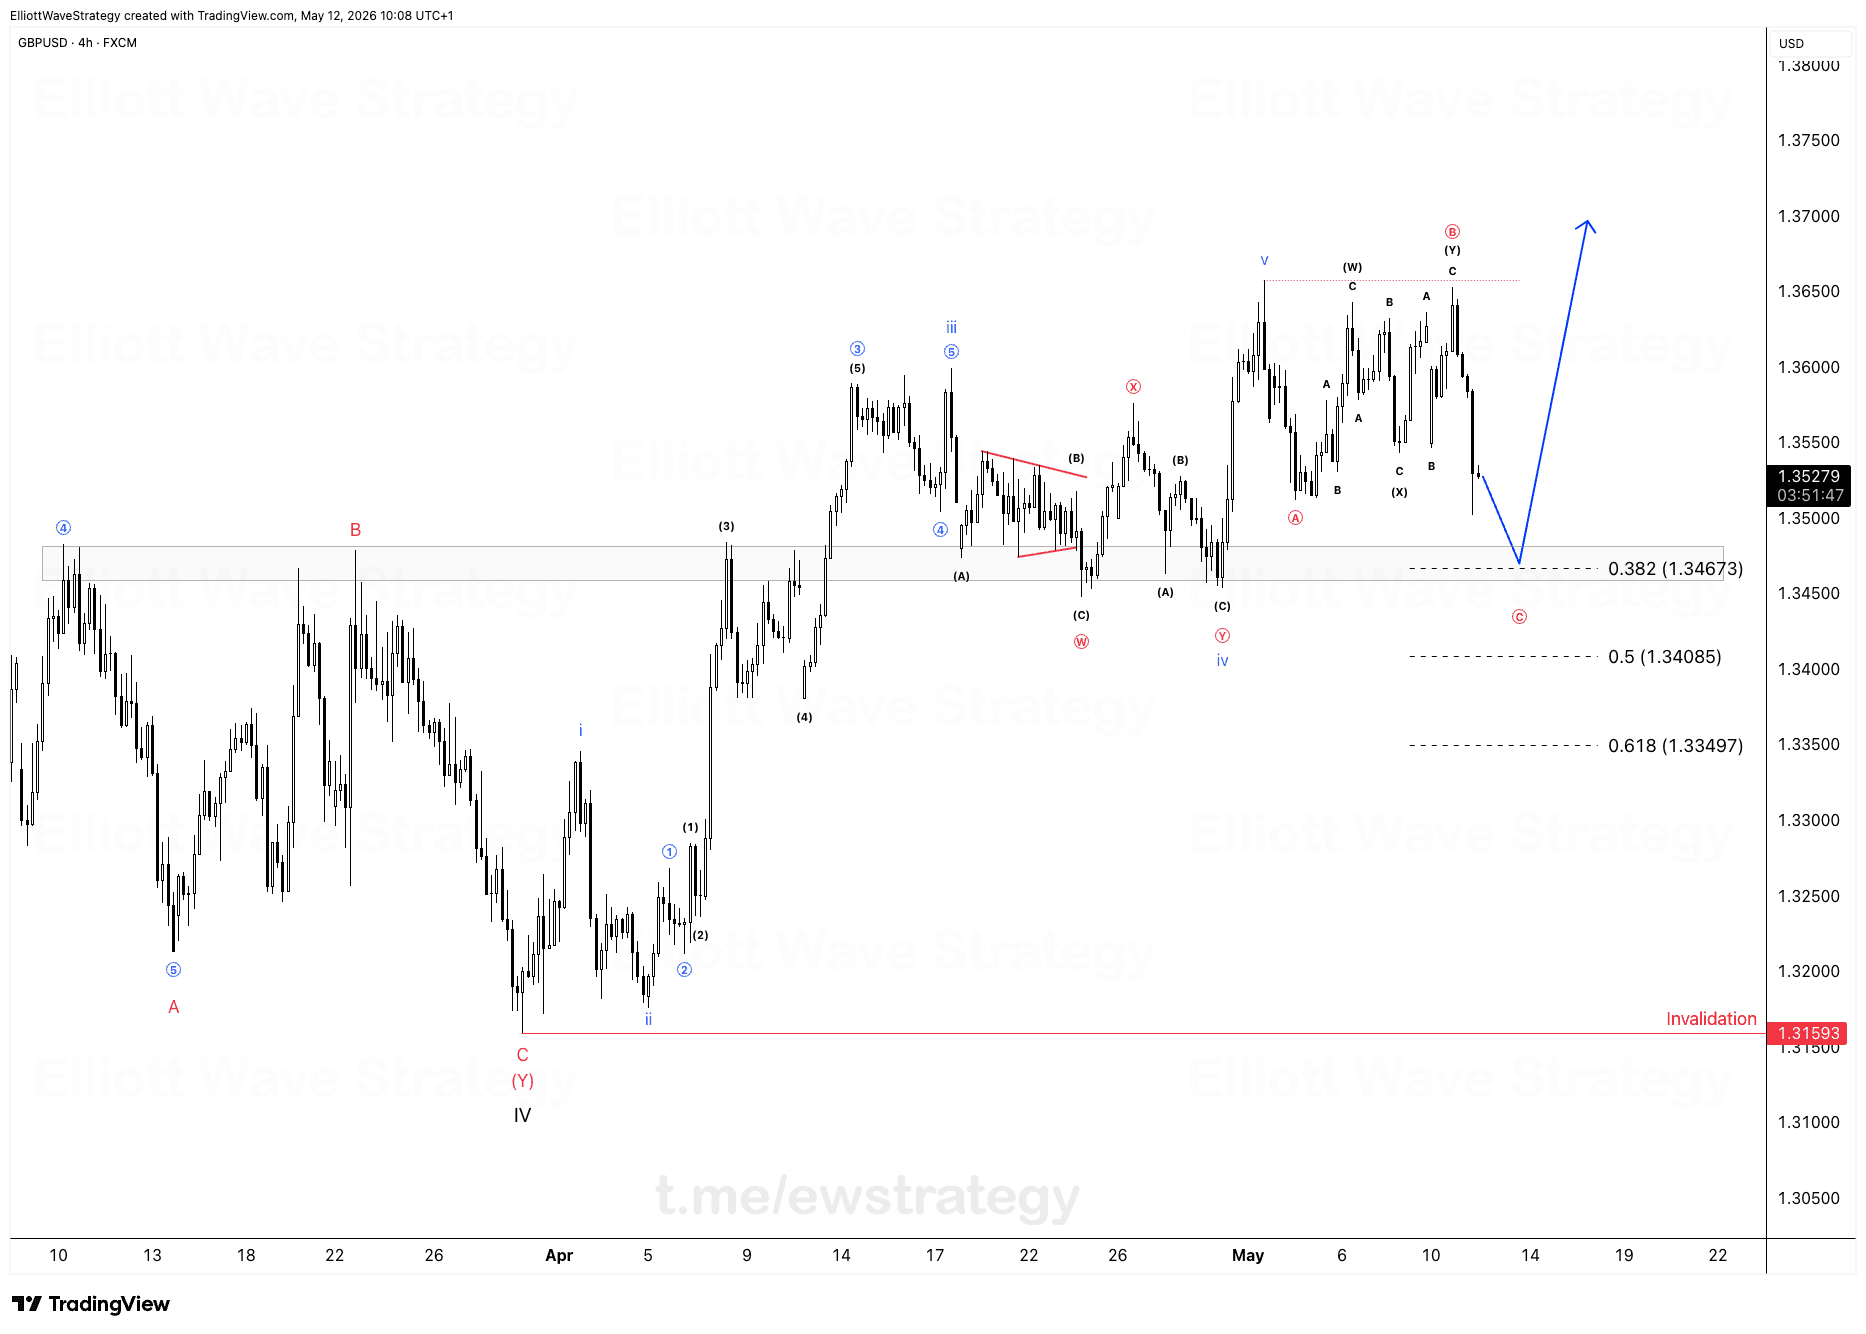
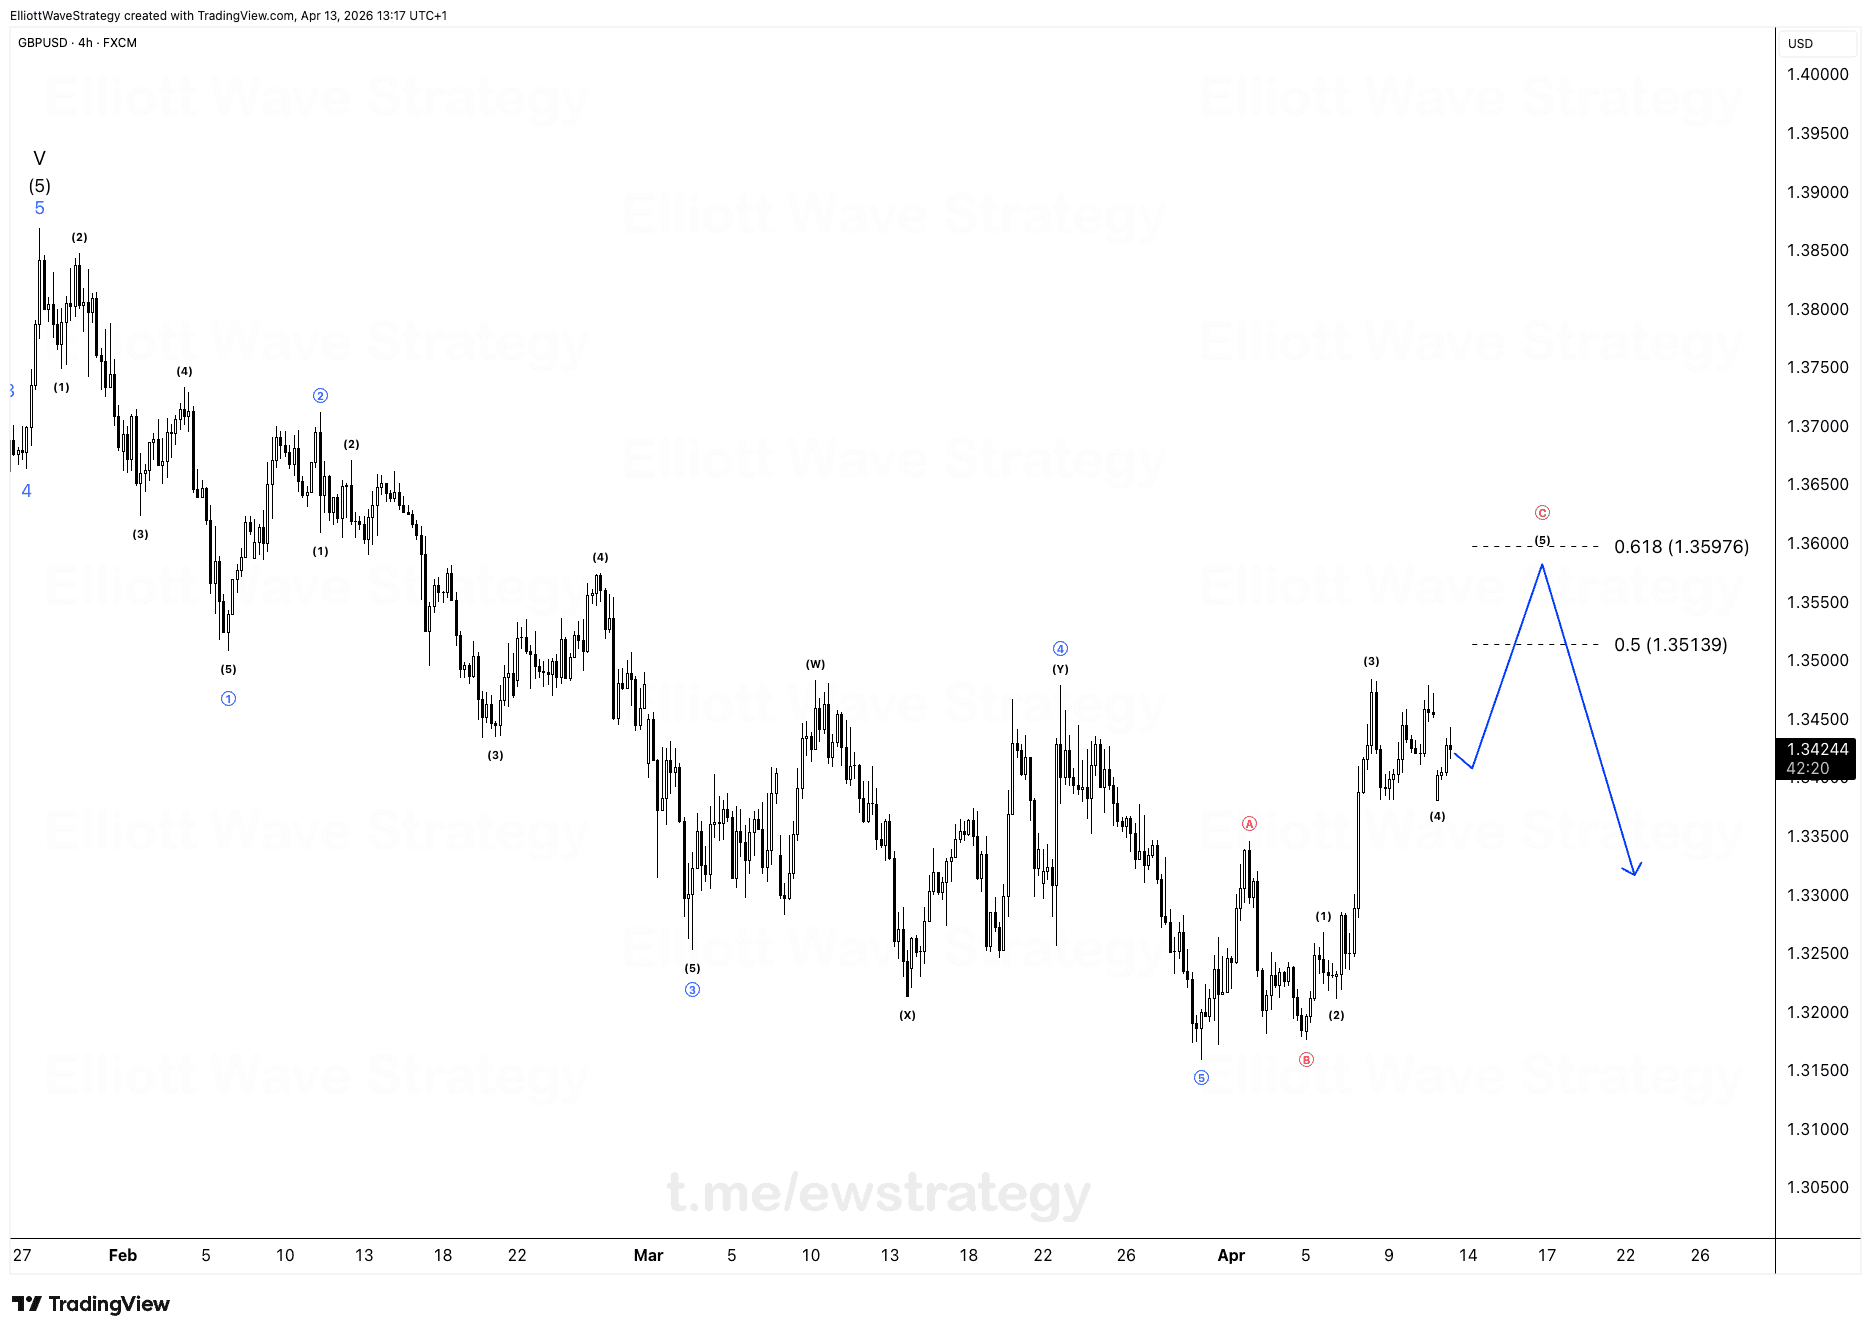
The larger decline from the highs above 1.3650 is the wave 1 move. A wave 2 correction ending here means the next major leg runs the other way.
What happens after wave 2 ends?
The first leg up is nearly done. I expect a pullback next, then another push higher.
That sequence matters. The first bounce off the low is wave i of the new advance. The pullback is wave ii, and the push after it is where the real move lives. Traders who chase the first leg usually get shaken out in the pullback, then watch the second leg run without them.
The chart shows my projected path: a dip, then a rally back toward the 1.3450 area. That is a trajectory, not a target and not a promise. The pullback is the part most people will not want to hold through.
What invalidates the GBPUSD bullish count?
Below 1.31372 the count is wrong. That is the exact low of the spike, printed on the chart as the invalidation level.
There is no gray area here. If price trades under that low, wave 2 was not finished, and the correction is still running. I would drop the count and start over rather than argue with the market.
A clean invalidation is the whole point of an Elliott Wave count. You always know when you are wrong.
Pullback first, or straight up from here?
I lean pullback first. The impulse off the low is extended already, and markets rarely go from a spike low to a clean trend without a retest of the structure.
But the count does not depend on the pullback. It depends on 1.3137 holding. Everything above that low is the bullish case.
What do you see: pullback first, or straight up from here?
Key Takeaways
- •GBPUSD hit 1.3137 on Wednesday after breaking the range low, then reversed immediately, which the Elliott Wave count reads as the end of wave 2.
- •The sideways range before the spike is a WXY correction inside wave (c) on GBPUSD, with the break below the range low as the final leg.
- •The GBPUSD bullish count is invalidated by any trade below 1.31372, the low of the reversal spike.
- •After the first leg higher, the GBPUSD count expects a pullback, then another push up, rather than a straight-line rally.
Frequently Asked Questions
What invalidates the bullish GBPUSD Elliott Wave count?
A trade below 1.31372, the low of the Wednesday spike. That level is the end of wave 2 in this count, so breaking it means the correction was not finished.
What is the WXY correction in the GBPUSD chart?
It is the sideways range inside wave (c) of wave 2. Wave (w) is the top of the range, (x) is the range low, and (y) is the final push, followed by the break that hit 1.3137.
Does GBPUSD need to pull back before moving higher?
The count expects a pullback after the first leg up, then another push higher. The pullback is not required for the count to hold, only that price stays above 1.31372.
Disclaimer: This analysis is for educational purposes only and does not constitute financial advice. Elliott Wave analysis involves subjective interpretation. Always do your own research and manage your risk accordingly.
Get Full Coverage for All 27 Instruments
Premium members receive daily wave counts with entry zones, targets and invalidation levels, published daily across all 27 instruments.
View Premium Plans