GBPUSD Elliott Wave: Wave (ii) Ends in the 0.5-0.618 Zone
📍 Cable pulled back into the 0.5 - 0.618 zone. My read: wave (ii) ends here.
Cable pulled back into the 0.5 - 0.618 zone. My read: wave (ii) ends here.
The climb off the 1.31372 low was wave (i). The drop we are watching now is its correction. The next leg up should start from this zone.
Where does the GBPUSD pullback stand in the Elliott Wave count?
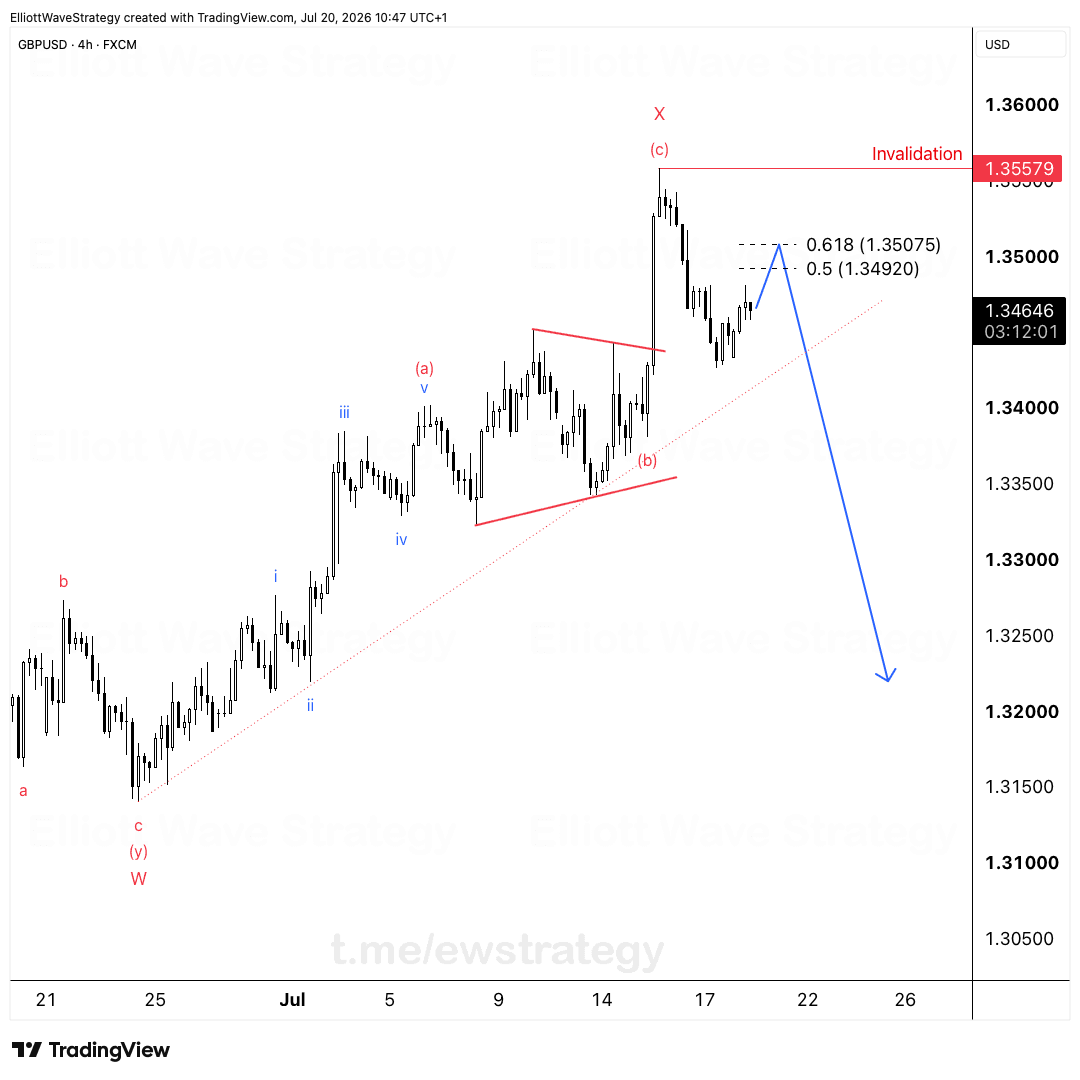
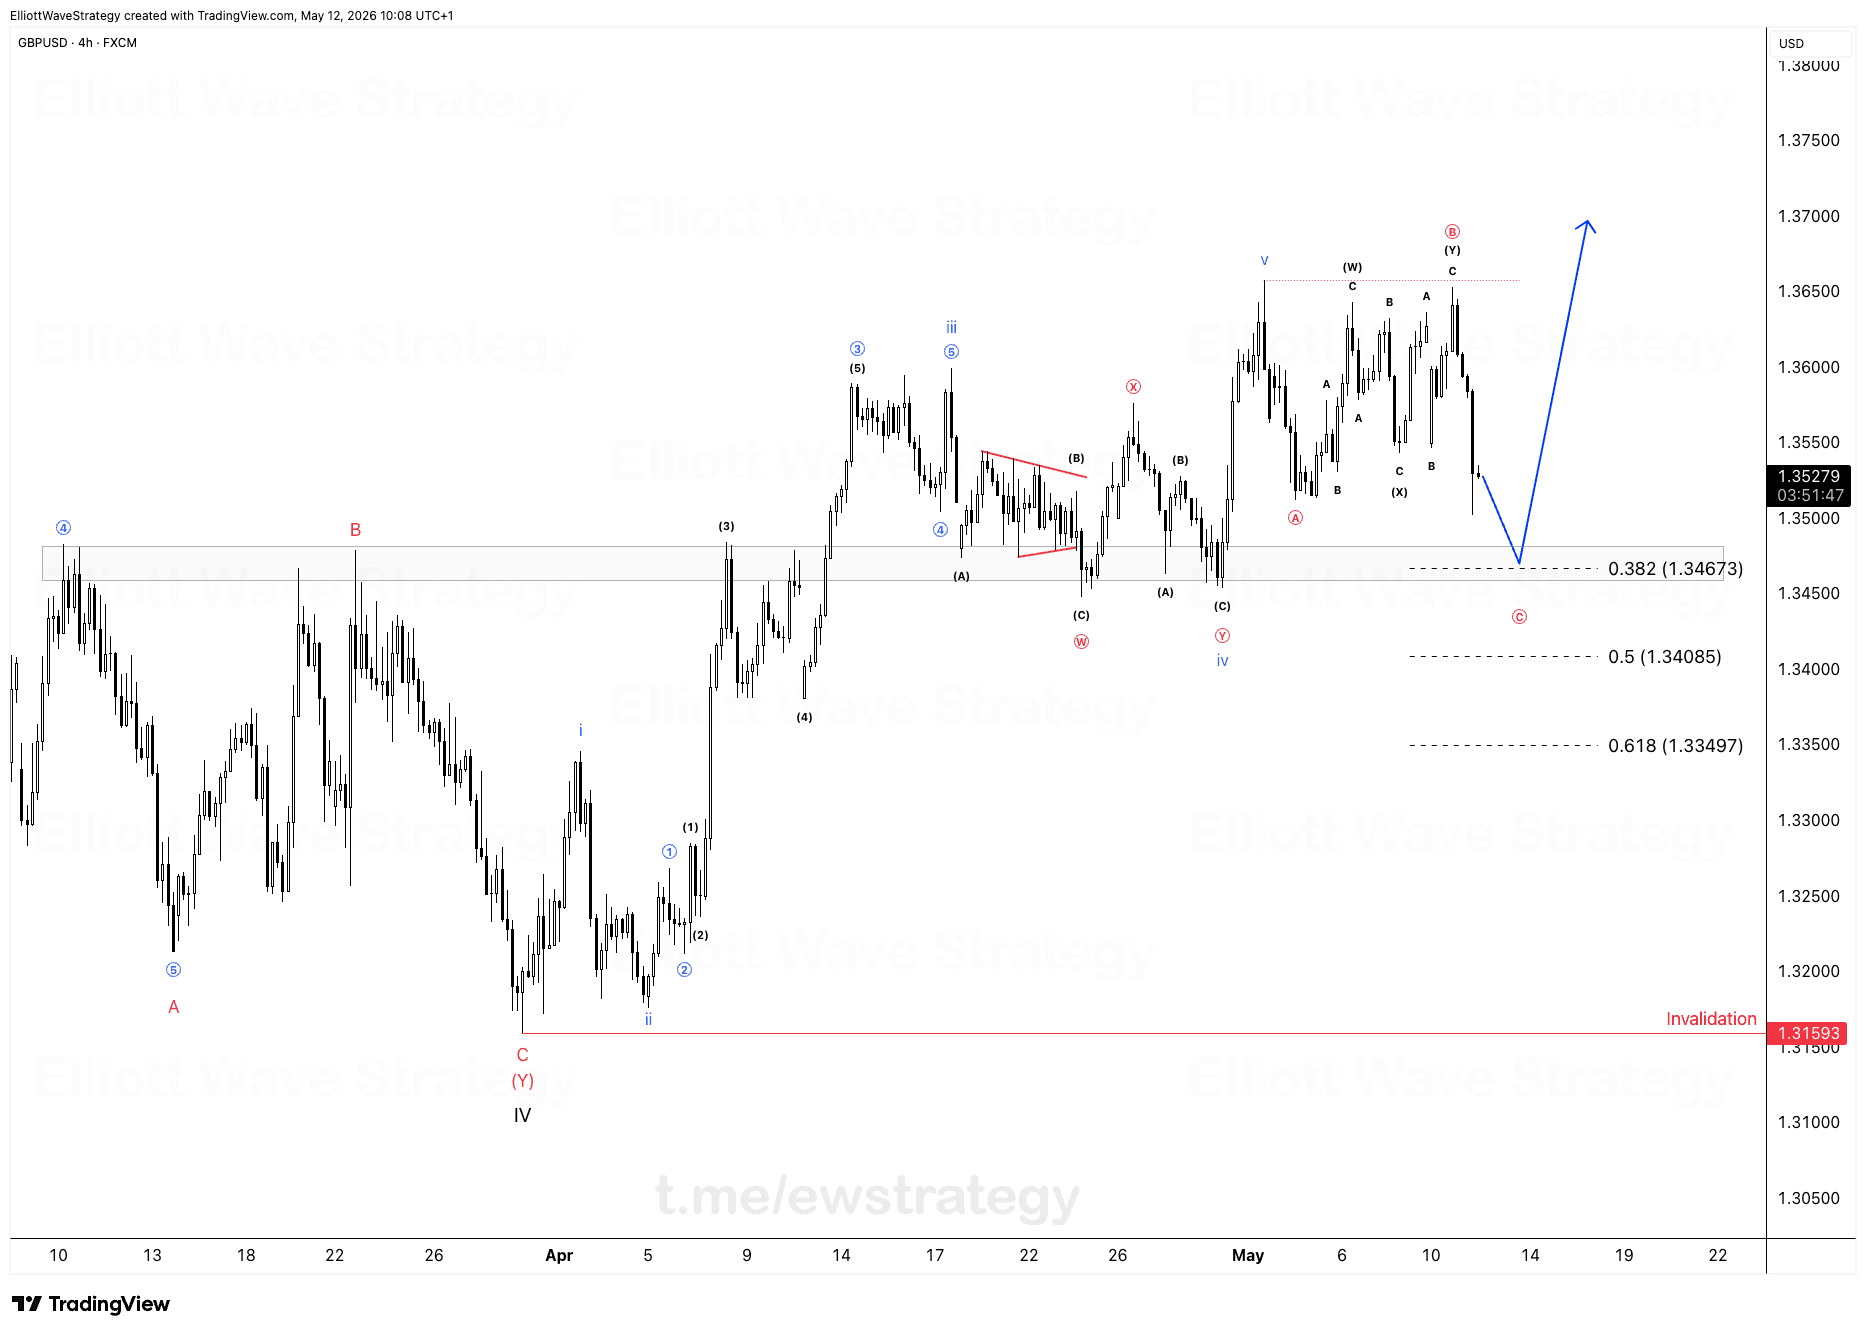
Price sits inside the 0.5 - 0.618 retracement zone of wave (i). That is the standard area where a second wave finishes, and it is why I am treating this as wave (ii) and not the start of something bigger.
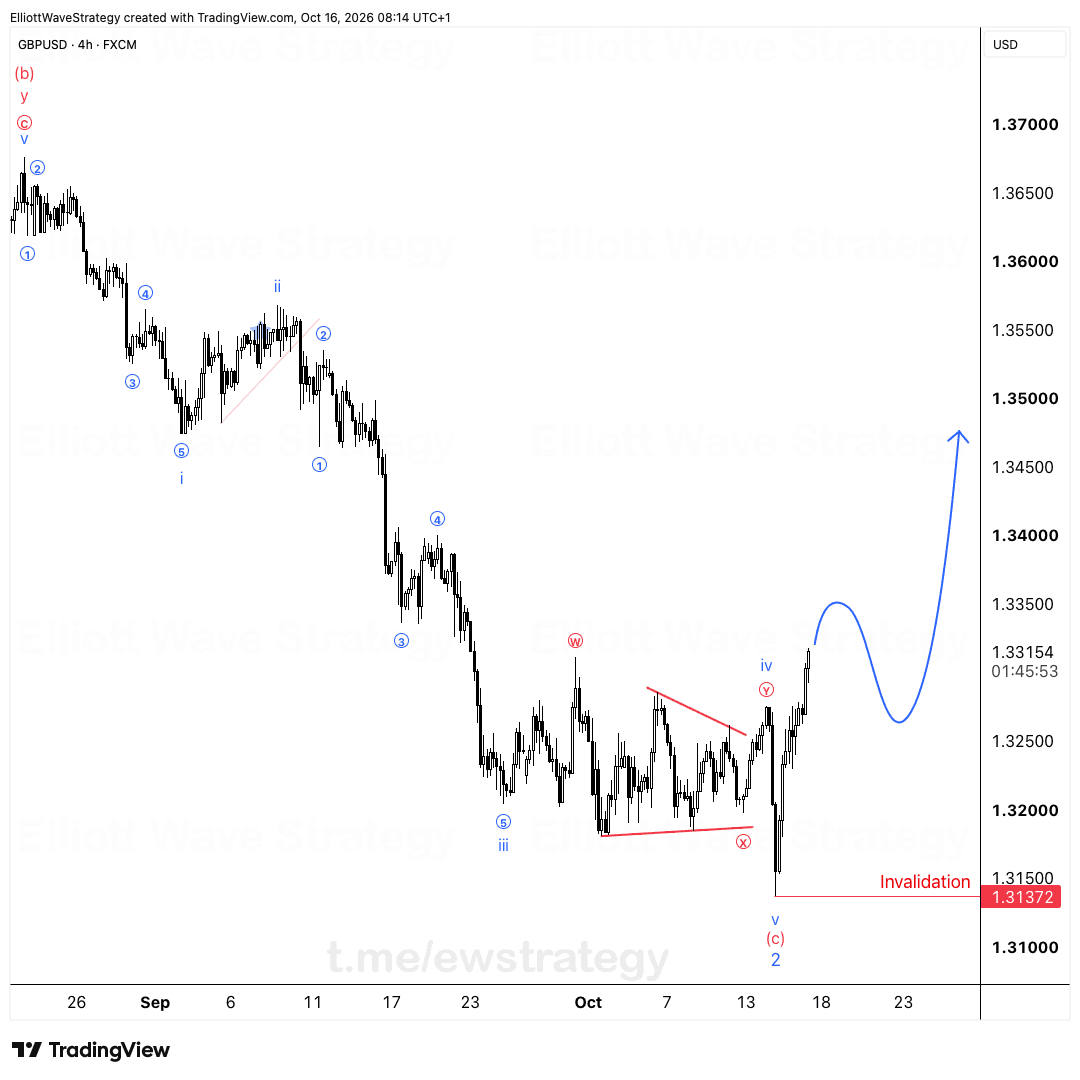
The bigger picture on the 4h chart: the decline from the (b) high came in as a completed sequence, ending with wave (c) of 2 at 1.31372. Everything since then is the first stage of a new advance. Wave (i) up, wave (ii) down into the Fibonacci zone, then the third wave, which is usually where the real move happens.
Why is the 0.5 - 0.618 zone the area to watch for wave (ii)?
Second waves retrace a large part of the first wave, and the 0.5 - 0.618 band is where most of them stop. Traders who only look at price see a falling market and panic. Traders who count waves see a correction doing exactly what corrections do.
The zone is a range, not a line. Price does not have to turn on the first touch. It can poke into the lower part of the box and still be a valid wave (ii).
What does the blue arrow on the chart show?
The blue arrow is my expected path: a turn from this zone and a push higher that clears the wave (i) high and runs toward the 1.36000 area on the chart. That is a projection of the count, not a promise. Wave (iii) is the leg that should travel, and it starts only once wave (ii) is done.
The arrow is why the zone matters. If the correction ends here, the move that follows is the one worth having a plan for.
What about the Fed decision tonight?
There is a Fed decision tonight, so price can poke a bit deeper into the zone first. That does not change the plan. News volatility pushes price around inside a structure, it does not rewrite the structure.
A deeper poke into the 0.618 area would still be consistent with wave (ii). What would not be consistent is a break below 1.31372.
What invalidates the GBPUSD count?
A break below 1.31372 and the count is wrong. That is the low of wave (c) of 2, the bottom of the whole decline. If price takes it out, wave (i) up was not wave (i), and I drop this scenario.
That is the point of an invalidation level. It tells you exactly where the idea stops working, so you are not arguing with the chart after the fact.
Key Takeaways
- •GBPUSD pulled back into the 0.5 - 0.618 retracement zone of wave (i), which is the typical area for a wave (ii) to end.
- •The GBPUSD Elliott Wave count treats the advance off 1.31372 as wave (i) and the current drop as its correction, wave (ii).
- •The expected next move on GBPUSD is a third-wave advance from the current zone, shown by the blue arrow toward the 1.36000 area on the chart.
- •A break below 1.31372 invalidates the bullish GBPUSD count, because that low marks the end of wave (c) of 2.
- •Tonight's Fed decision can push GBPUSD deeper into the 0.5 - 0.618 zone without changing the wave (ii) structure.
Frequently Asked Questions
What invalidates the bullish GBPUSD Elliott Wave count?
A break below 1.31372, the low of wave (c) of 2. If price trades under that level, the advance off the low was not a wave (i) and the bullish count is wrong.
Why is the 0.5 - 0.618 zone important for GBPUSD?
Wave (ii) corrections commonly end between the 0.5 and 0.618 retracement of wave (i). GBPUSD is sitting inside that band, which is why the count treats the pullback as a completed or nearly completed second wave.
Can the Fed decision change the GBPUSD wave count?
News can push price deeper into the 0.5 - 0.618 zone, but that stays inside the wave (ii) structure. Only a break below 1.31372 changes the count.
Disclaimer: This analysis is for educational purposes only and does not constitute financial advice. Elliott Wave analysis involves subjective interpretation. Always do your own research and manage your risk accordingly.
Get Full Coverage for All 27 Instruments
Premium members receive daily wave counts with entry zones, targets and invalidation levels, published daily across all 27 instruments.
View Premium Plans