XAGUSD Elliott Wave: Silver Diagonal Low at 58.5 Holds
First part played out. Silver bounced off 58.5, ran to 61.4, then pulled back into the 0.5-0.618 zone near 60 and held it this morning. That's the shape I wante
First part played out. Silver bounced off 58.5, ran to 61.4, then pulled back into the 0.5-0.618 zone near 60 and held it this morning.
That's the shape I wanted after the diagonal low. Now the next leg decides whether this count is right.
What is the Elliott Wave count on XAGUSD right now?
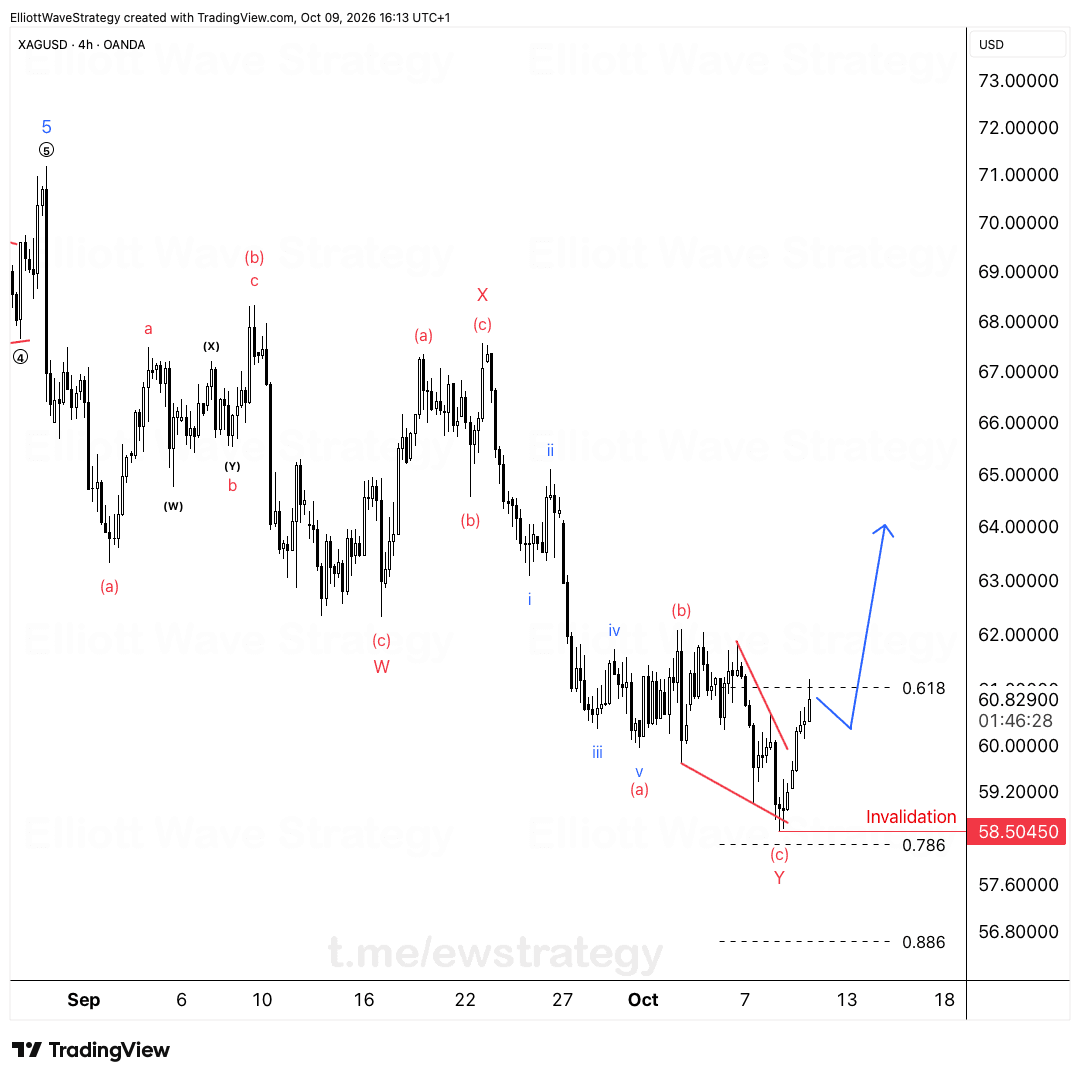
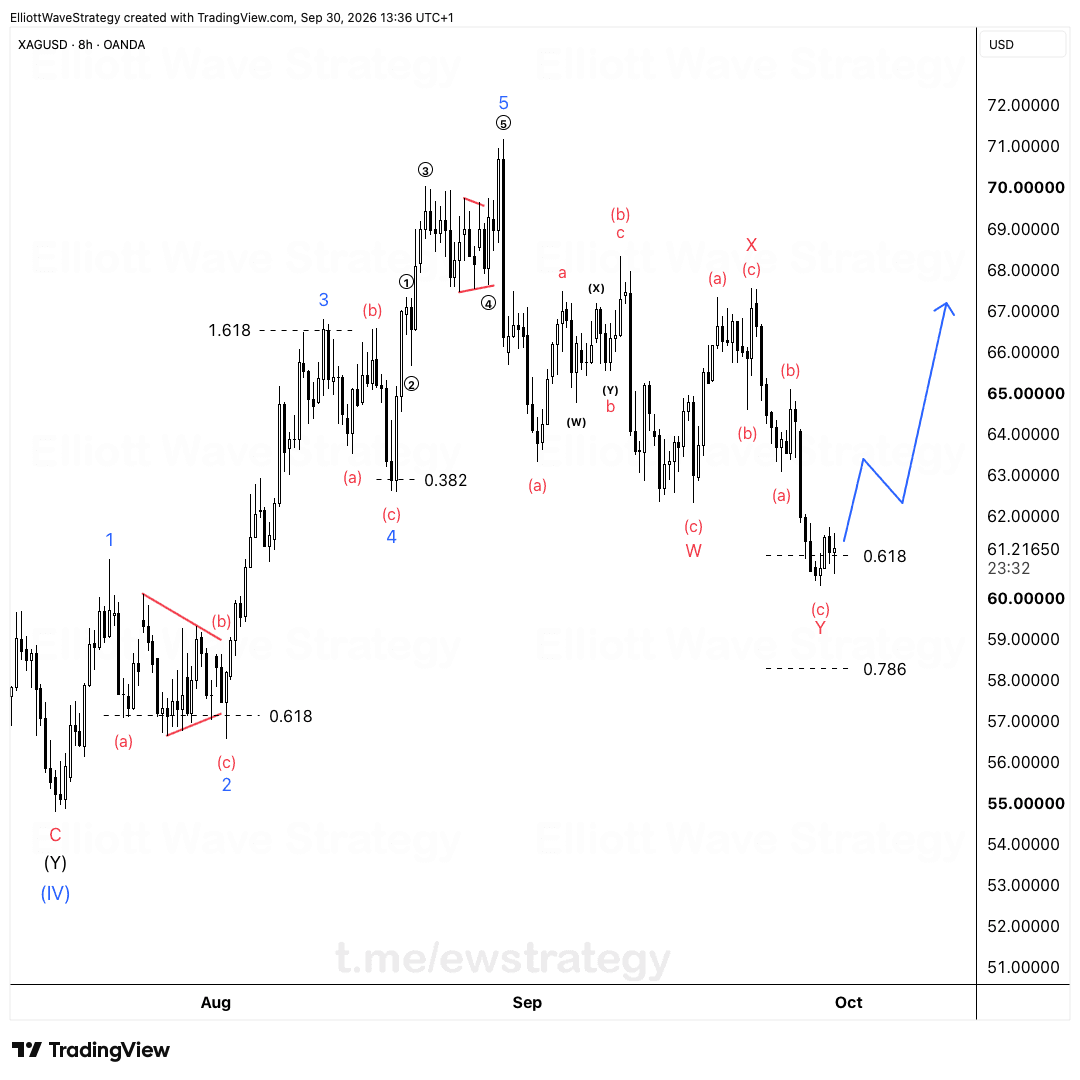
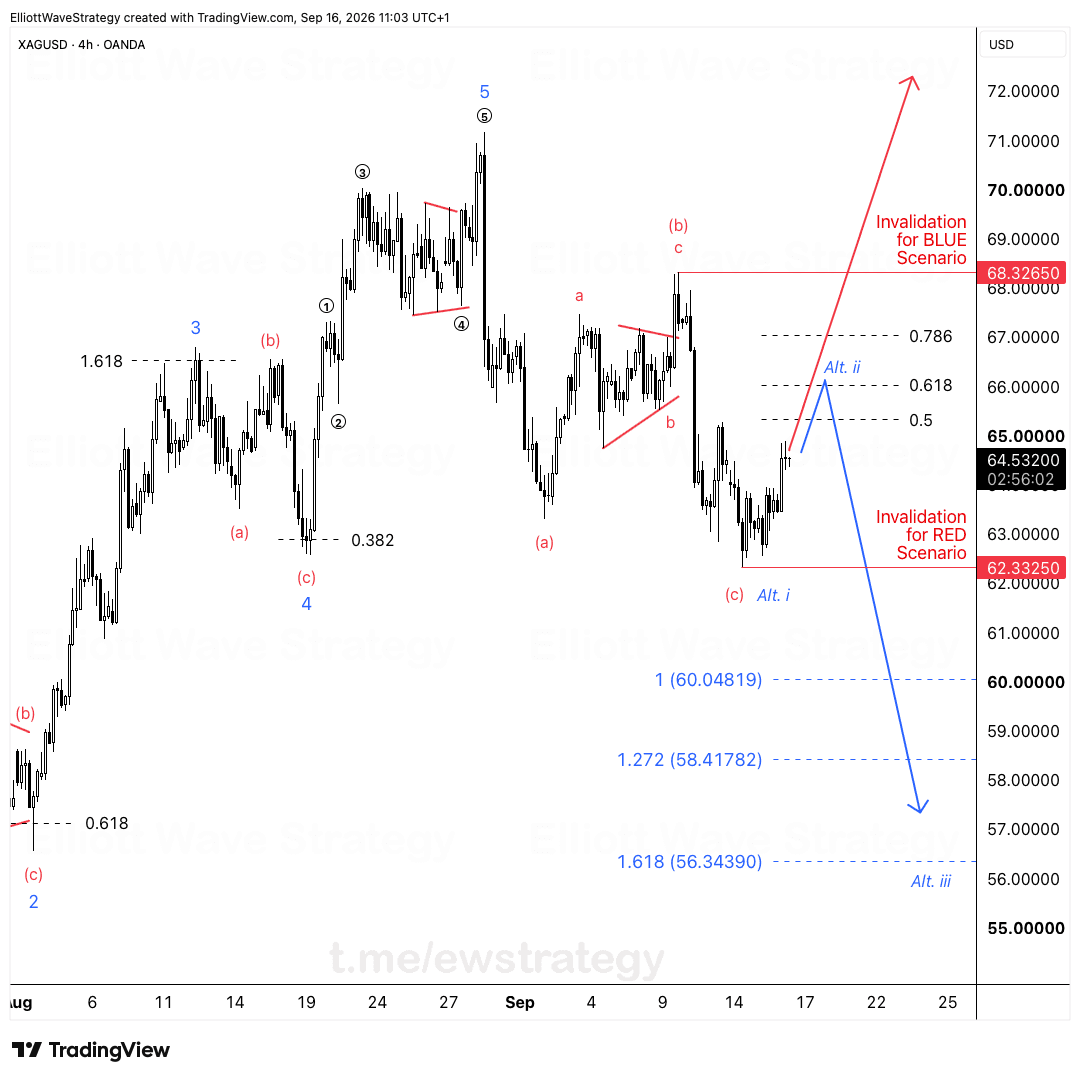
My count is a W-X-Y correction. Wave W ended with its (c) leg in mid-September. Wave X bounced from there and topped out around 67. Wave Y then dragged price lower in three legs, (a), (b), (c).
The (a) leg ran down in a five-wave sequence labeled i through v. The (b) leg gave a bounce near 62, and the (c) leg finished the move.
That structure is a double zigzag-style correction, not a fresh impulse lower. The distinction matters because corrections end, and when they end, price returns to the prior trend.
Why does the 58.5 diagonal low matter for silver?
Wave (c) of Y ended inside a diagonal, and the low of that diagonal sits at 58.5. Diagonals in the final position of a correction often mark exhaustion: price keeps grinding lower, but the legs overlap and momentum fades.
The red trendlines on the chart show the wedge. Price broke out of it to the upside, then rallied to 61.4.
That breakout is the first piece of evidence. A diagonal that ends a move is supposed to get reversed fast, and silver did exactly that.
Where is the pullback holding on XAGUSD?
The dip after the 61.4 high retraced into the 0.5-0.618 Fibonacci zone, which sits near 60. Price tagged it and held this morning.
If the bounce off 58.5 was the first leg of a new advance, this pullback is the corrective dip inside it. A 0.5-0.618 retracement is the normal depth for that kind of pullback. Going deeper than that would start to damage the idea.
Holding the zone does not prove anything by itself. It keeps the count alive, and that's all I ask of it at this stage.
What is the upside target for silver?
The next push should be the bigger one, toward 67. The blue arrow on the chart shows the trajectory: a short dip first, then a sharp advance from the 60 area up into the high 60s.
A 67 target also lines up with the wave X high, which makes it a logical area for a recovery to reach.
This is the scenario I'm tracking. It is not a promise, and it is not a signal.
What invalidates the silver count?
If price loses 58.5, the W-X-Y read is wrong and I rework the count.
That's the whole invalidation rule. No averaging down on a theory, no hoping. Below 58.5 the diagonal is not the end of wave (c), and the structure needs a new interpretation.
A count without an invalidation level is just an opinion. This one has a price attached.
For how corrections like this fit into the bigger picture across gold, silver and oil, see the commodities Elliott Wave guide.
Key Takeaways
- •XAGUSD bounced from the 58.5 diagonal low and ran to 61.4 before pulling back into the 0.5-0.618 zone near 60.
- •The XAGUSD Elliott Wave count is a W-X-Y correction, with wave (c) of Y ending inside a diagonal at 58.5.
- •If the 61.4 rally was the first leg of a new advance, the next push in silver should be the bigger one, toward 67.
- •A loss of 58.5 invalidates the W-X-Y count on XAGUSD and forces a rework of the structure.
- •The pullback holding at 60 keeps the bullish silver scenario intact but does not confirm it.
Frequently Asked Questions
What invalidates the bullish XAGUSD Elliott Wave count?
A move below 58.5. That level is the low of the diagonal that ended wave (c) of Y, so losing it means the W-X-Y correction is not complete and the count has to be reworked.
Why does an ending diagonal matter in an Elliott Wave correction?
An ending diagonal in the final leg of a correction signals exhaustion. Price grinds lower in overlapping legs, and a fast breakout to the upside after the low is the typical sign the correction is done.
What is the XAGUSD target if the W-X-Y count holds?
The target is toward 67. The expectation is that the bounce from 58.5 was the first leg, the dip into the 0.5-0.618 zone near 60 was its pullback, and the next push is the larger one.
Disclaimer: This analysis is for educational purposes only and does not constitute financial advice. Elliott Wave analysis involves subjective interpretation. Always do your own research and manage your risk accordingly.
Get Full Coverage for All 27 Instruments
Premium members receive daily wave counts with entry zones, targets and invalidation levels, published daily across all 27 instruments.
View Premium Plans